-
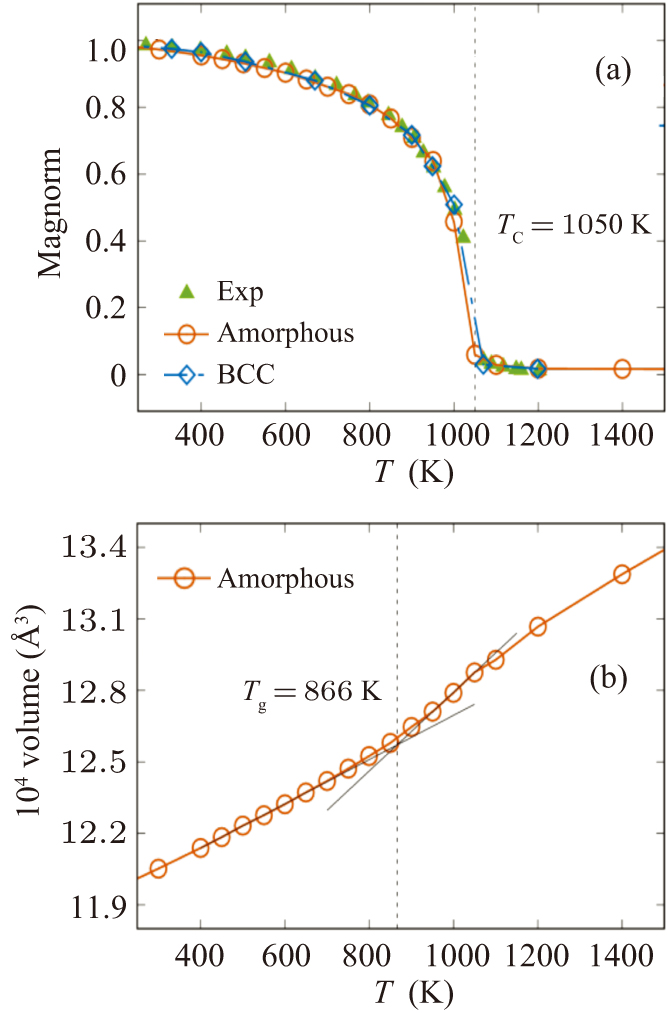
Figure 1. (a) Variation of magnetization intensity in simulations with temperature for amorphous and BCC Fe. The fulfilled triangles are the experimental data for BCC irons.[29–33] The value at the inflection point is the Curie temperature. (b) Variation of simulated box volume with temperature for amorphous Fe during the cooling process.
-
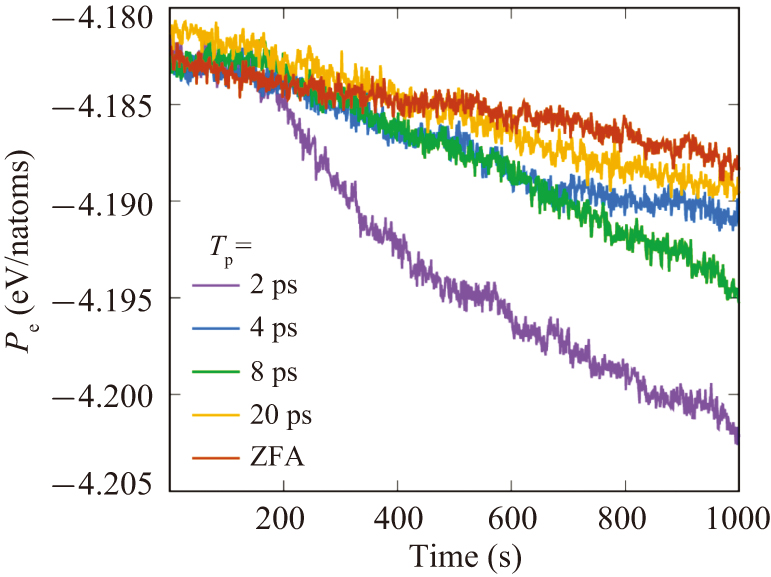
Figure 2. The variation of potential energy with time for the different applied periodic magnetic fields.
-
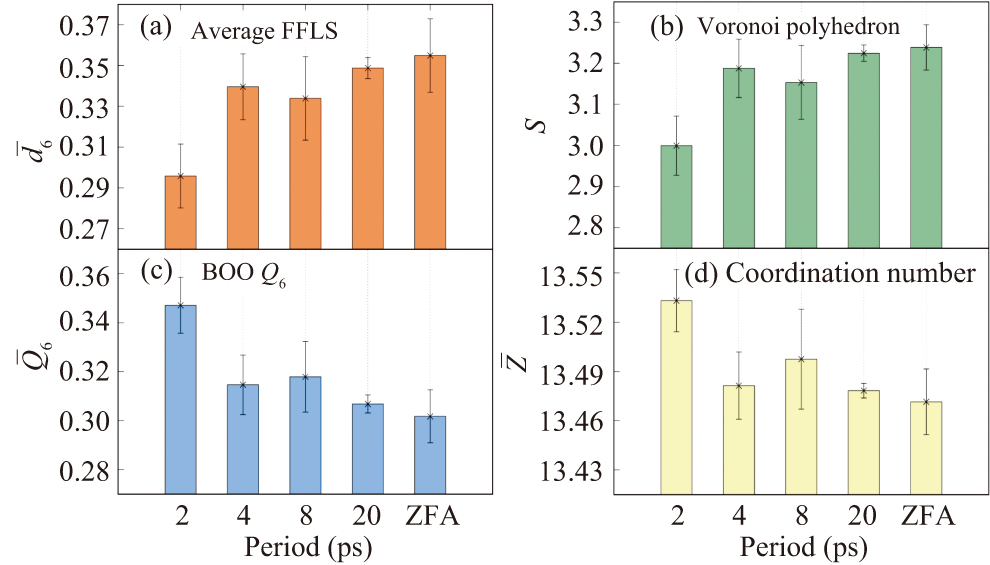
Figure 3. The local structural evolution with Tp at 500 K, with (a) the average LFFS (
-
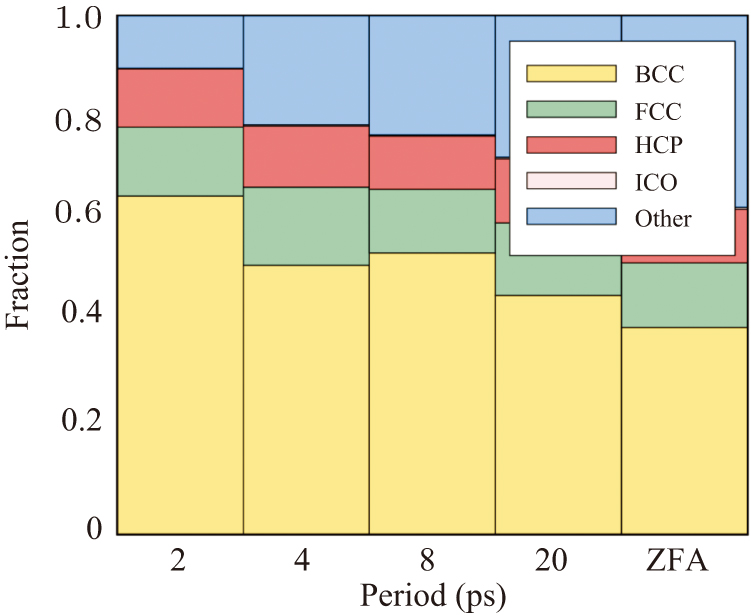
Figure 4. Fraction of ICO, HCP, FCC, BCC, and disordered structures in the samples quenched to 500 K with different magnetic annealing Tp.
-
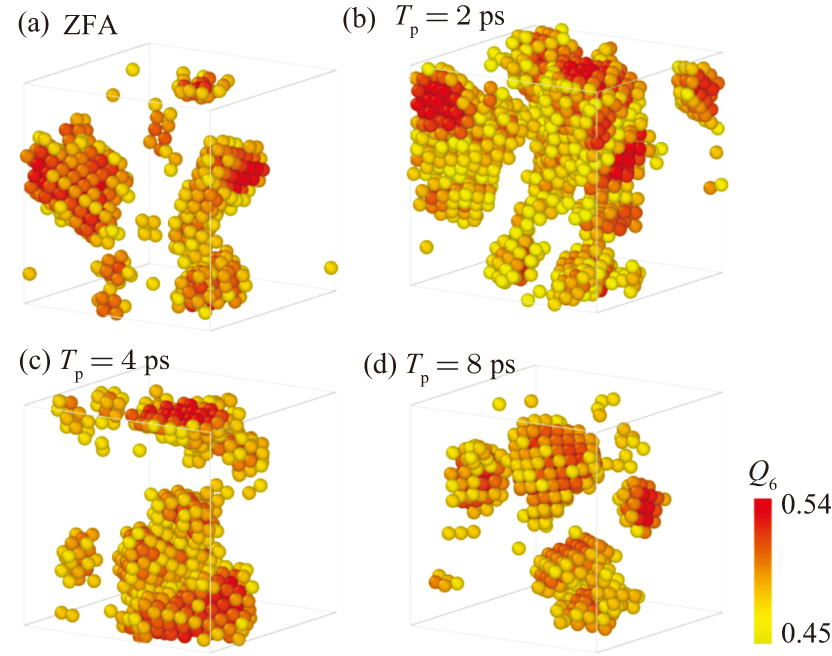
Figure 5. Snapshot of atoms with the coarse-grained order parameter Q6 larger than 0.45 at T = 50 K with (a) ZFA, (b) Tp = 2 ps, (c) Tp = 4 ps, and (d) Tp = 8 ps. The atoms are colored according to the value of Q6.
Figure
5 ,Table
0 个