-
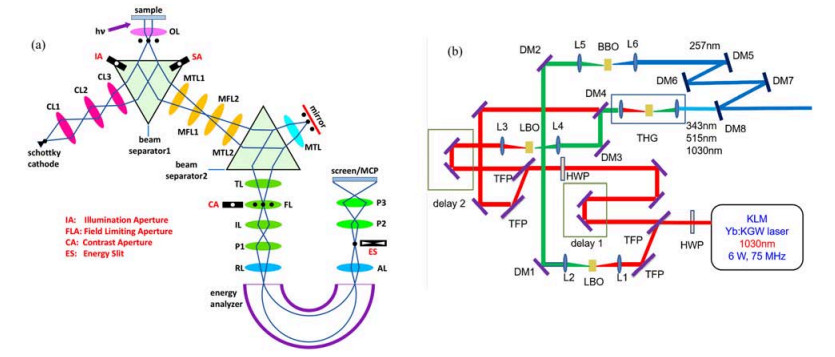
Figure 1. (a) A schematic of the pump-probe laser path. The pump and probe pulses enter the UHV chamber collinearly and are focused onto the sample by a convex lens with an incidence angle of 74° relative to the surface normal. HWP: half-wave plate, TFP: thin film polarizer, L: lens, DM: dichromatic mirror, THG: third harmonic generation, KLM: Kerr lens mode-locking. (b) Electron-optical schematic of the aberration-corrected SPELEEM. CL: condenser lens, OL: objective lens, MTL: mirror transfer lens, MFL: mirror field lens, TL: transfer lens, FL: field lens, IL: intermediate lens, RL: retarding lens, AL: accelerating lens, P: projector
-
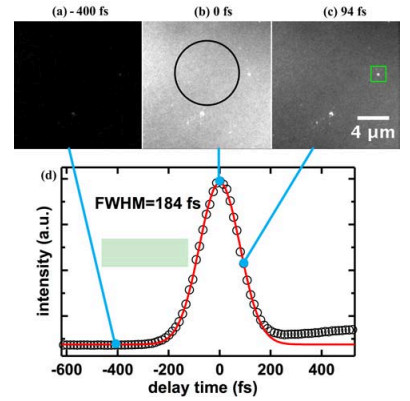
Figure 2. Time resolution performance of the setup, measured on a SiO
$ _2 $ /Si surface. TR-PEEM images taken at (a)$ \Delta t $ =$ - $ 400 fs, (b)$ \Delta t $ = 0 fs, and (c)$ \Delta t $ = 94 fs. The bright dots in the images originate from particles on the surface. (d) Average PEEM signal intensity (black curve) vs.$ \Delta t $ was collected from the surface area circled in (b). Fitting the time profile (red curve) with a Gaussian function gives the cross-correlation of 184 fs FWHM -
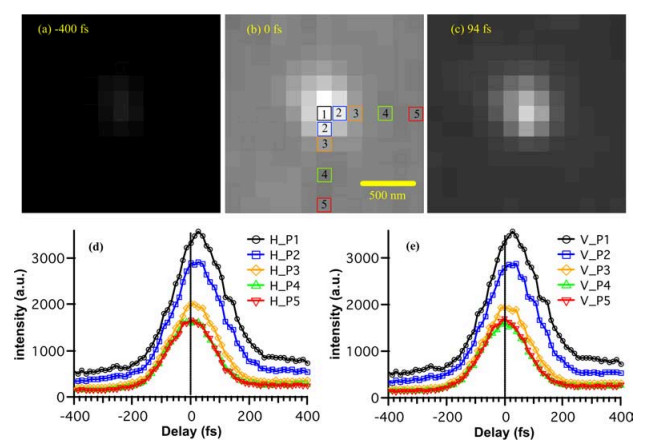
Figure 3. Magnification of the zone containing the bright spot in FIG. 2(c) marked with a green square. (a
$ - $ c) The magnified images of this zone in FIG. 2(a-c), correspondingly. (d) and (e) The PEEM intensity profiles versus delay times collected from five marked pixels (P1 to P5 in (b)) in the horizontal (H) and vertical (V) directions, respectively -
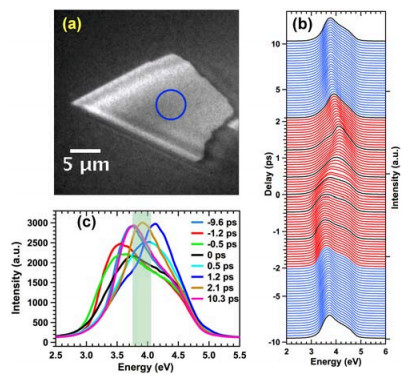
Figure 4. (a) A PEEM image of the Pb island grown on Si(111)-7
$ \times $ 7 surface at room temperature. (b) Photoelectron spectra at different time delays collected from the selected area marked with a blue circle on the Pb island in (a). The spectra are offset vertically by 66.6 fs in red and 226 fs in blue sequentially for clarity. Seven spectra curves with the black color are picked out from the delay series and replotted in (c). The gray bar in (c) is a visual guide -
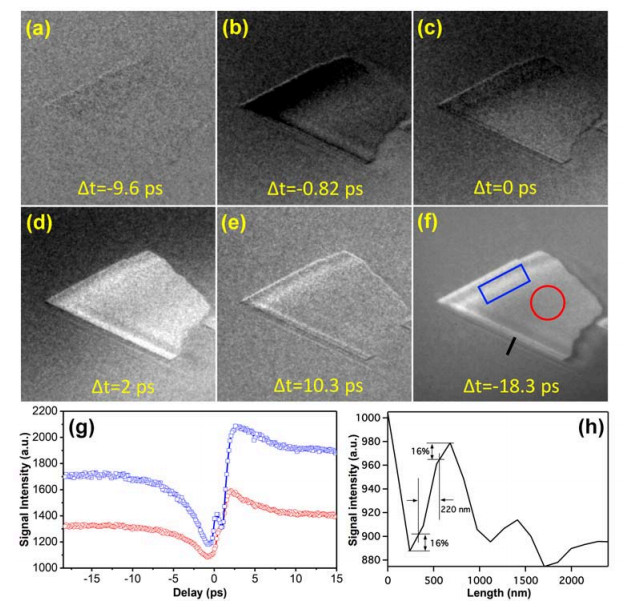
Figure 5. Time-resolved spectro-microscopy images recorded at (a)
$ \Delta t $ =$ - $ 9.6 ps, (b)$ \Delta t $ =$ - $ 0.82 ps, (c)$ \Delta t $ = 0 ps, (d)$ \Delta t $ = 0.94 ps, and (e)$ \Delta t $ = 2 ps. The above images were processed by subtracting the image recorded at (f)$ \Delta t $ =$ - $ 18.3 ps as background to enhance the change. All the images were formed by selecting electrons of certain energy with the energy slit, for an energy window of 0.3 eV, whose position in energy spectra is shown with the light grey shaded bar in FIG. 3(c). (g) Time-resolved intensities from blue squares and red circles on Pb island in (f). (h) A lateral resolution of 220 nm was roughly estimated from the intensity profile across the diffraction fringes (black solid line in (f)) beside the Pb island edge
Figure
5 ,Table
0 个