-
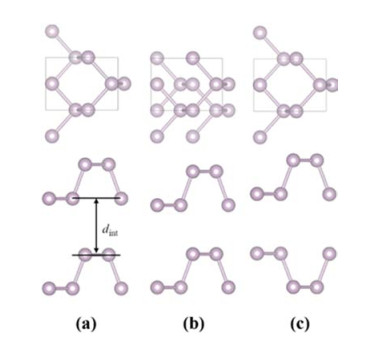
Figure 1. Top view and side view of phosphorene bilayers with (a) AA, (b) AB, and (c) AC-stacking orders are displayed.
-
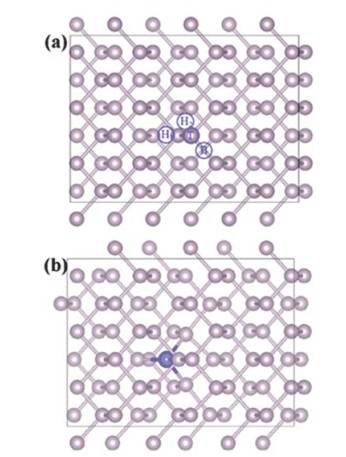
Figure 2. (a) Four possible adsorption sites of Co atom intercalated in phosphorene bilayer are labelled with H1, H2, T, and B, respectively; (b) the most favorable adsorption site for Co intercalation.
-
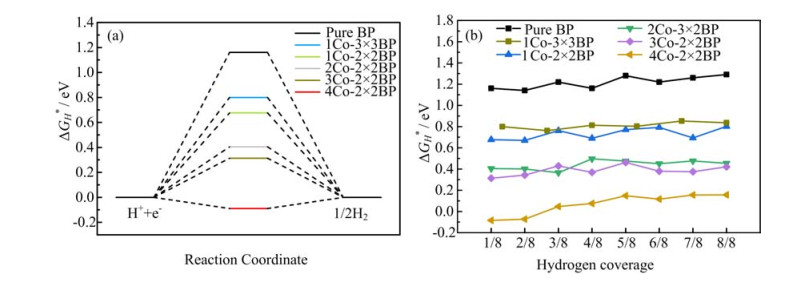
Figure 3. (a) The calculated Gibbs free energy diagram of HER at the equilibrium potential on Co-intercalated phosphorene bilayer with different Co concentrations. (b) The
$\Delta G_\textrm{H}$ values as a function of hydrogen coverage$\theta_\textrm{H}$ (ranging from 0 to 1) on the surface of the Co-intercalated phosphorene bilayer are displayed. -
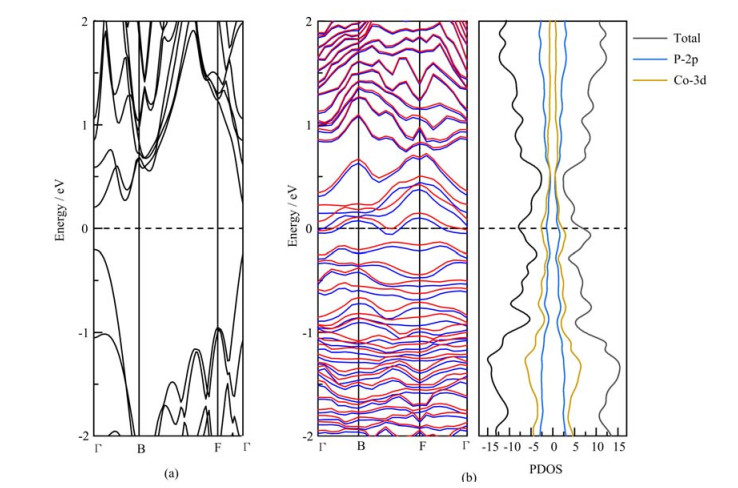
Figure 4. (a) The calculated electronic band structures of bilayer phosphorene. (b) The electronic band structure and PDOS of 4Co-2
$\times$ 2BP. The Fermi energy is set to zero. -
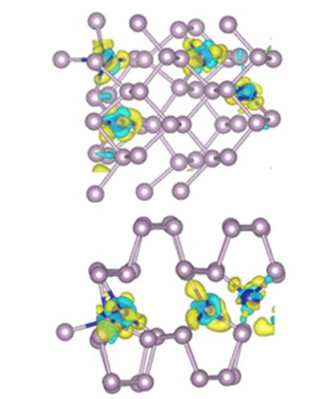
Figure 5. The charge density difference of 4Co-2
$\times$ 2BP is displayed. The isosurface value is 0.02 e/Å$^3$ . The gold region shows the charge accumulation, whereas the cyan region represents the charge depletion. -
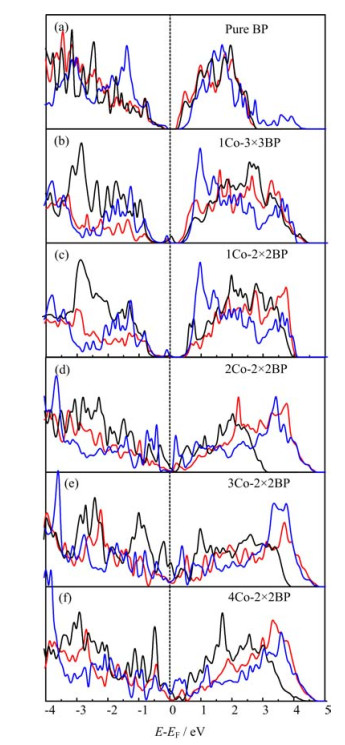
Figure 6. PDOS plots of Co intercalated phosphorene projected onto the P atom bonded to hydrogen atom before (black solid line) and after (red solid line) hydrogen adsorption. PDOSs of H 1s (blue solid line) are scaled up by a factor of five for better visualization.
Figure
6 ,Table
1 个