-
Figure 1. Schematic of the chemical synthesis process of Au@Cu NPs.
-
Figure 1. (a) Transmission electron microscopy (TEM) image of Au NPs, (b) TEM image of Au@Cu NPs, (c) STEM image and corresponding energy dispersive X-ray (EDX) elemental mapping images of Au@Cu NPs. (d) Normalized UV-Vis absorption spectra of Au and Au@Cu NPs dispersed in toluene.
-
Figure 2. Evolution of TA spectra with delay time of Au NPs (a–c) and Au@Cu NPs (d–f) dispersed in toluene. The excitation wavelength was 400 nm and pump fluence was 267.5 µJ/cm2. The arrows indicate the change of localized surface plasmon resonance band with delay time. Red arrow: signal rises and red shifts; blue arrow: signal decays and blue shifts; black arrow: decays only. (g–i) Comparing the kinetic profiles probe at (g) 523 nm, (h) 535 nm, and (i) 560 nm of Au NPs and Au@Cu NPs. Note that the dynamics curves have been normalized to make Au and Au@Cu have the overlapped rising edge. The dynamics at 560 nm is shown only the first 2 ps, due to the overlapping with positive signal at later time. The green arrows point to the differences between Au and Au@Cu.
-
Figure 3. Exponential fitting of TA dynamics of Au NPs and Au@Cu NPs with 400 nm excitation and pump fluence of 267.5 µJ/cm2. For Au NPs, the probe wavelength is (a) 523 nm, (b) 535 nm, and (c) 560 nm; and for Au@Cu NPs, the probe wavelength is (d) 523 nm, (e) 535 nm, and (f) 560 nm.
-
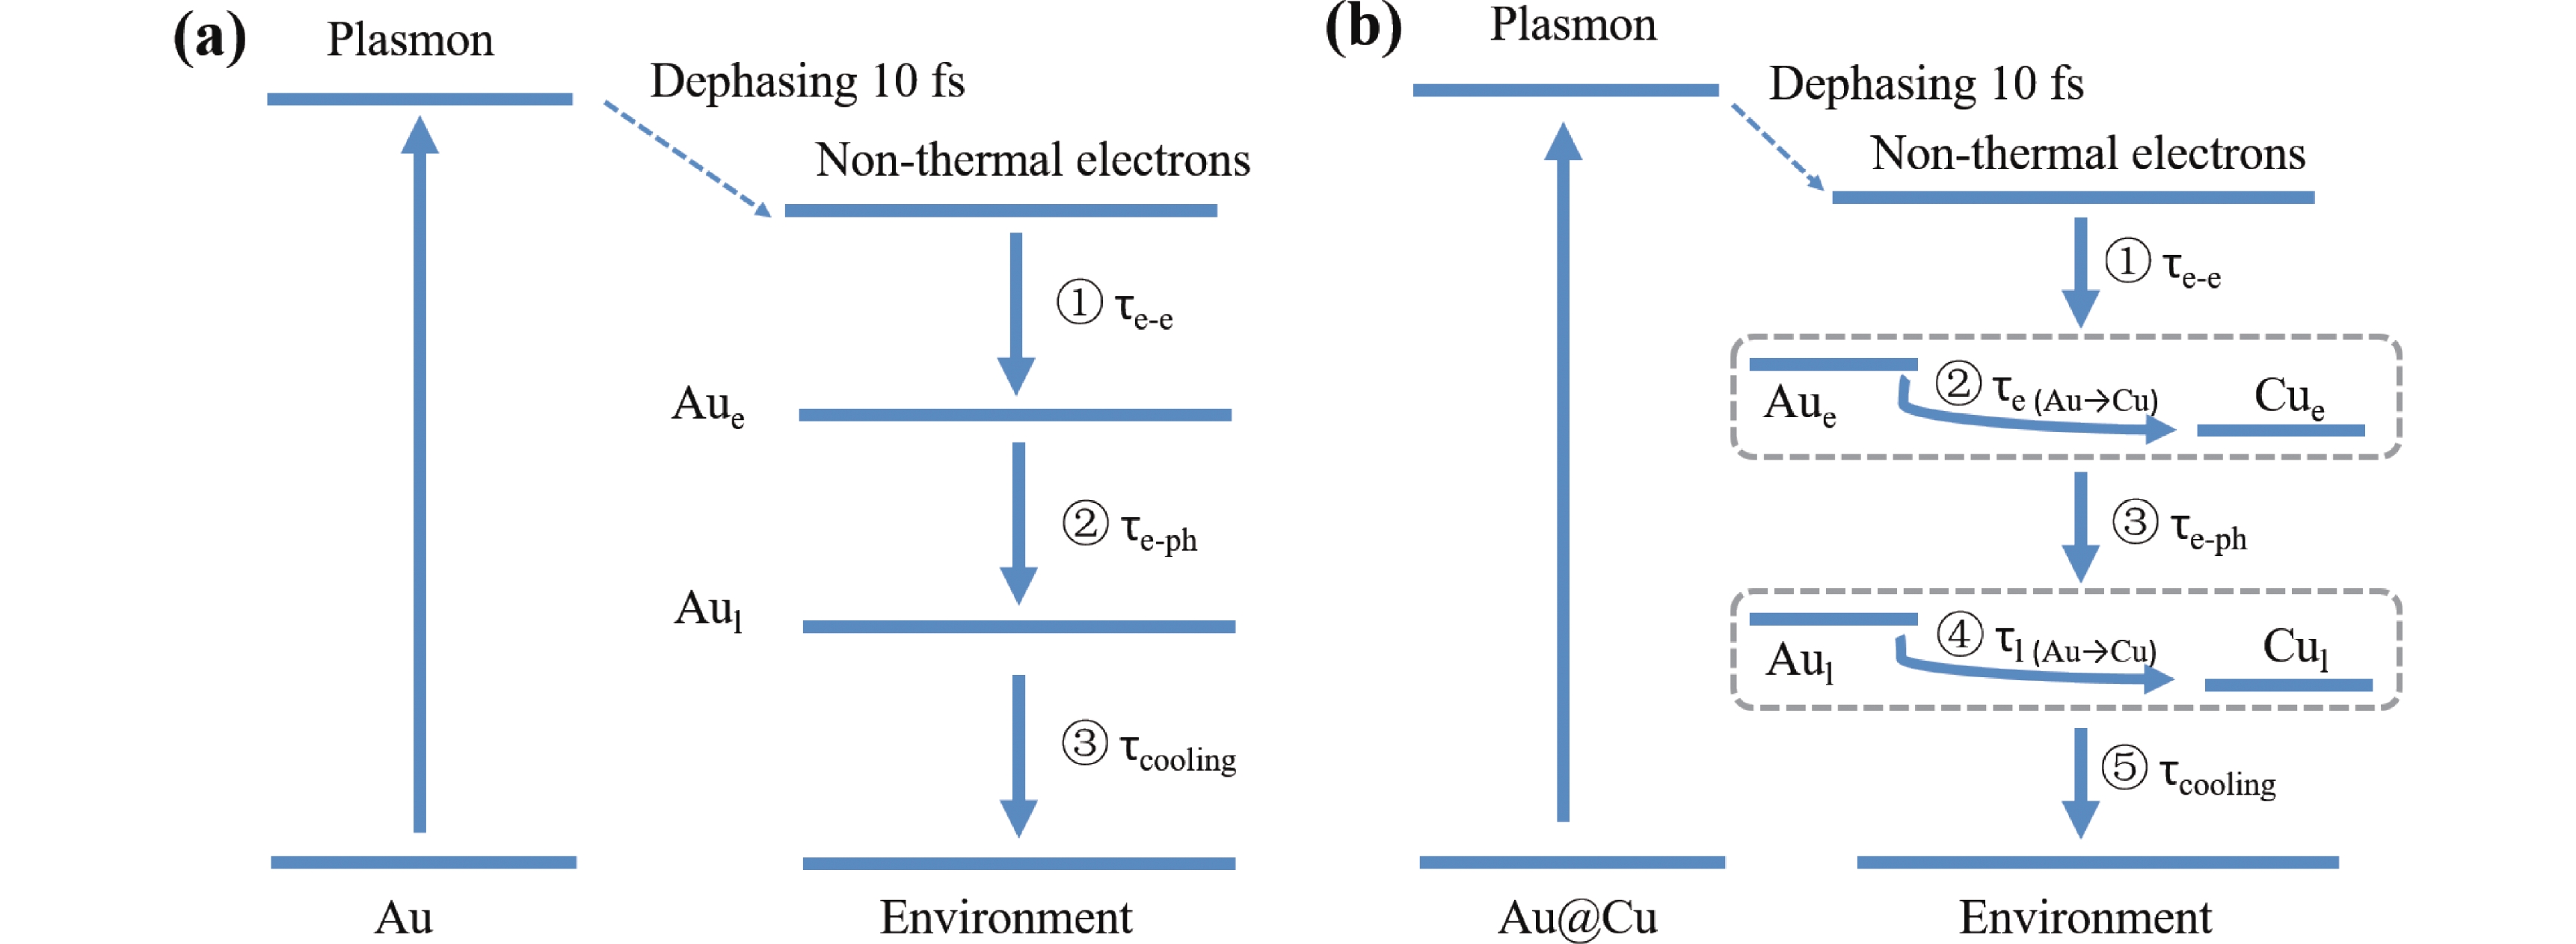
Figure 2. Proposed excited state relaxation of (a) Au NPs and (b) Au@Cu NPs. The equilibration time τe-e is for electron-electron scattering, τe (Au→Cu) is for electron temperature equilibrium, τe-ph is for electron-phonon coupling, τl (Au→Cu) is for lattice temperature equilibrium, τcooling is for lattice cooling.
-
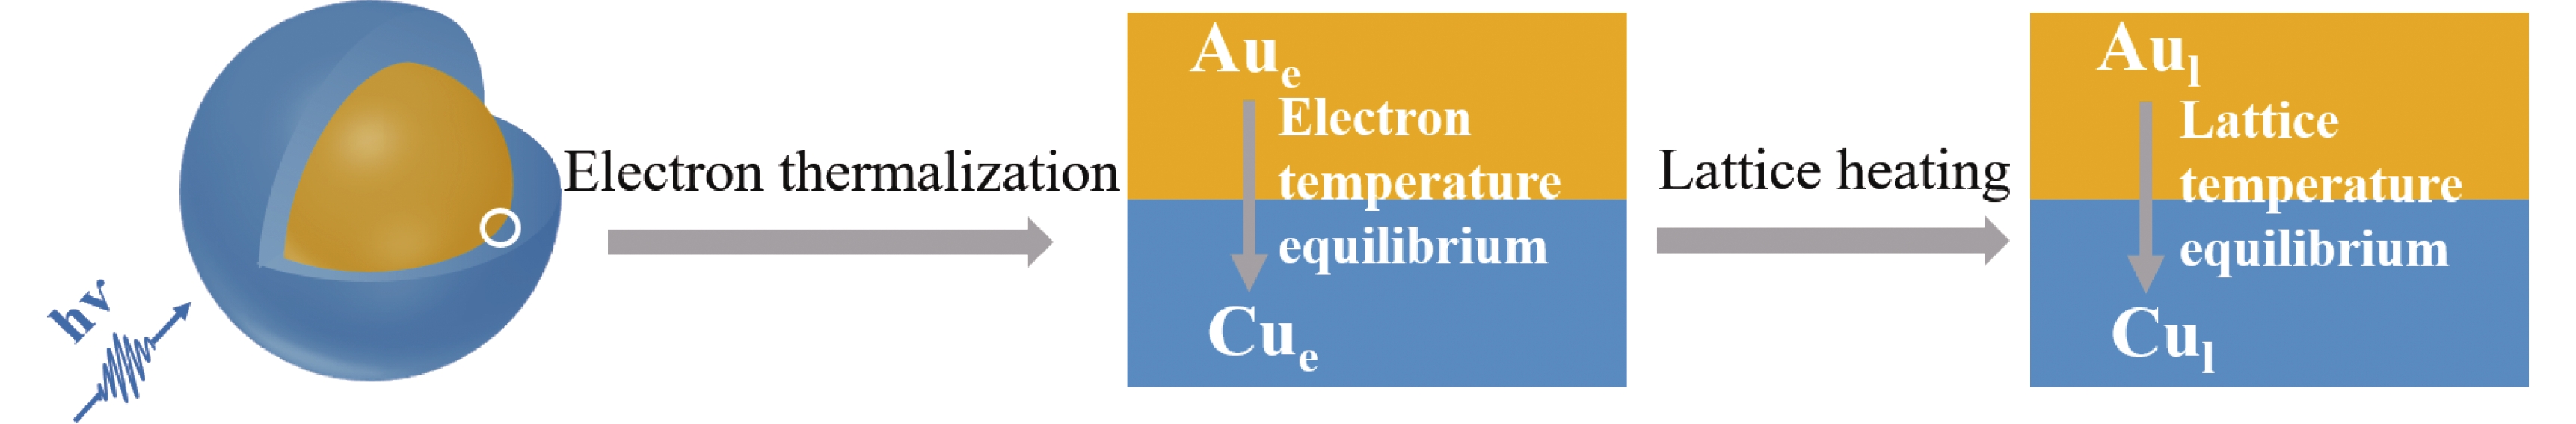
Figure 4. The main dynamic processes following LSPR excitation of Au@Cu NPs.
Figure
6 ,Table
1 个