-
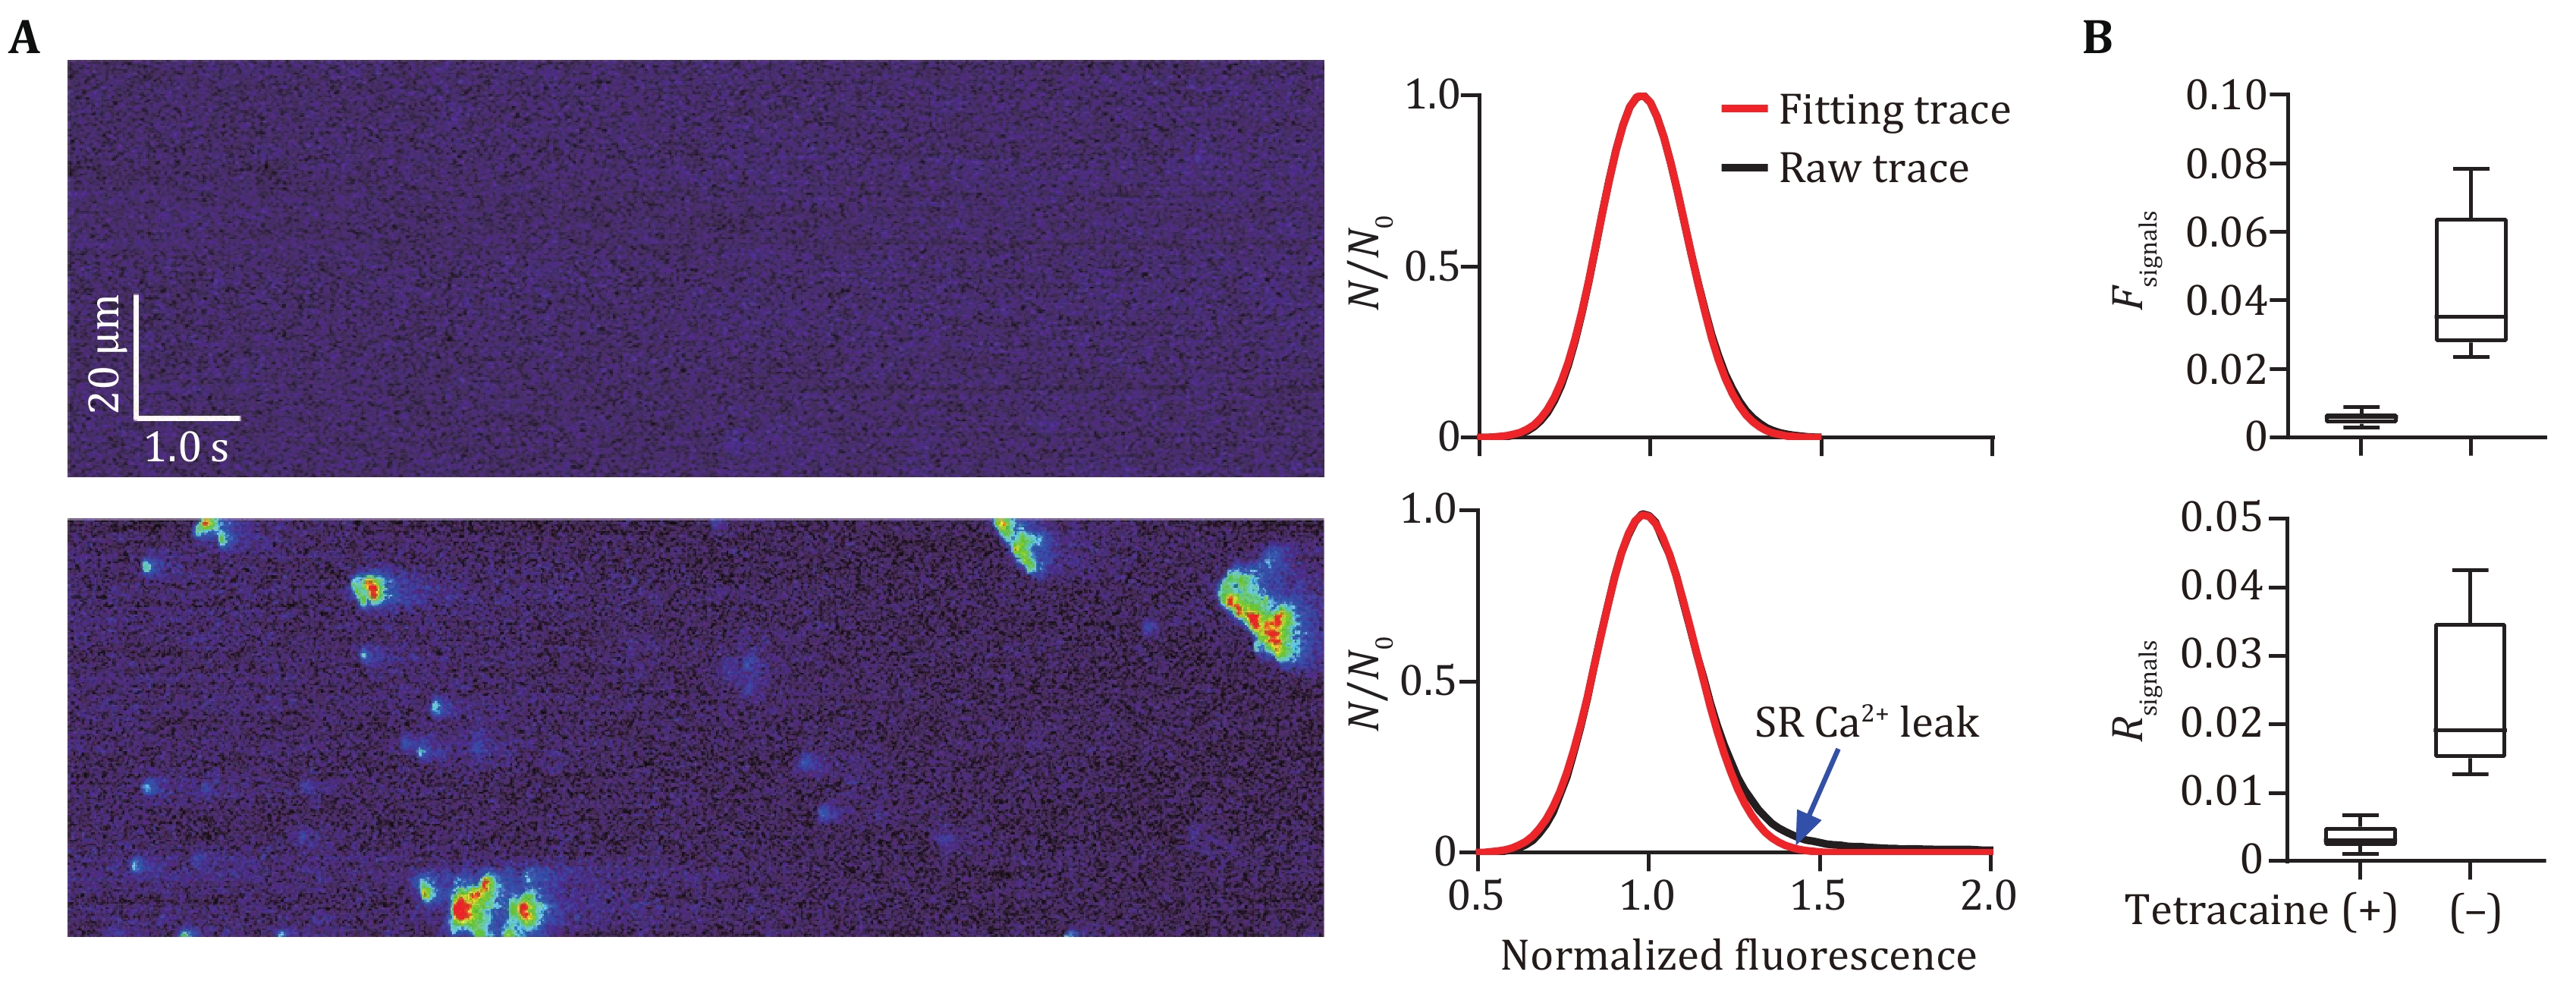
Figure 1. Separating Ca2+ signals from background noises in confocal line-scan images of atrial myocytes. A Typical normalized confocal line-scan Ca2+ images of atrial myocytes in the presence (upper) or absence (lower) of 10 μmol/L tetracaine, for which the histograms of pixel fluorescence were fitted into modified Gaussian curves in the right panel. The blue arrow indicates the difference between raw and fitting traces, which represents the signal components. B Statistics of Fsignals and Rsignals calculated from the histogram and corresponding fitting curves of line-scan Ca2+ images of atrial myocytes from the WT mice in the presence or absence of tetracaine, n = 10 atrial myocytes from three mice per group
-
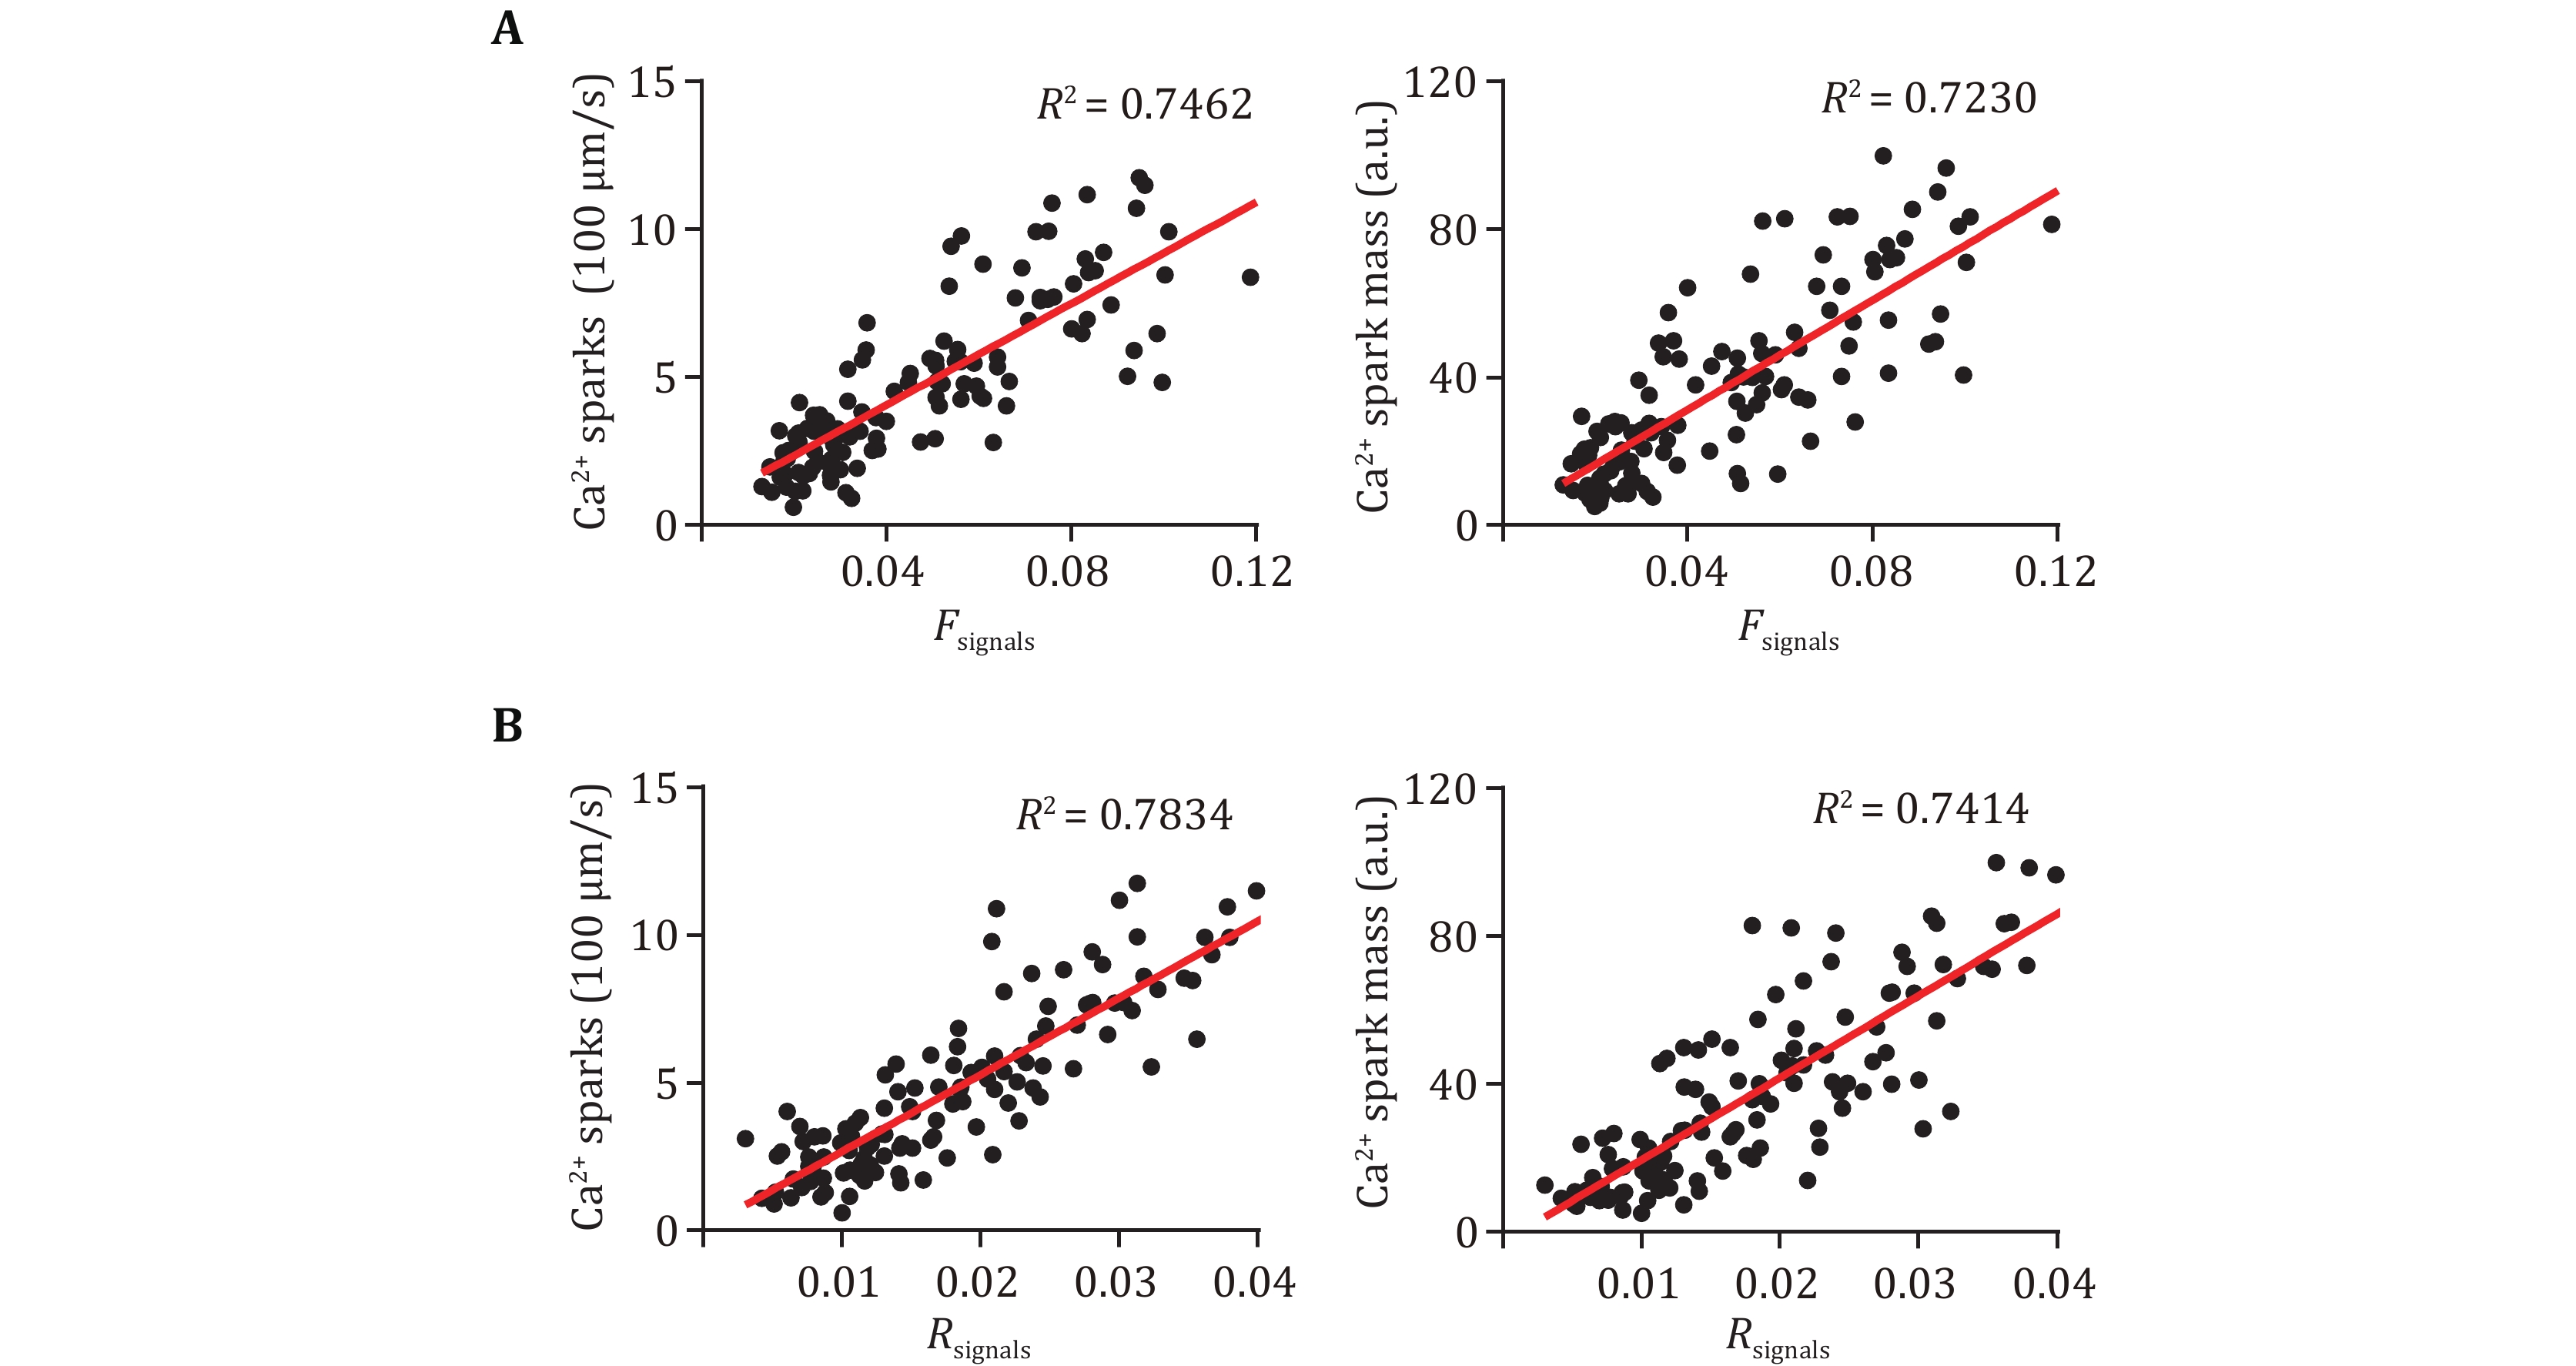
Figure 2. The correlations between the new parameters Fsignals (A) and Rsignals (B), and Ca2+ spark readouts. Line-scan Ca2+ images were processed for Ca2+ spark detection and new parameters calculation, and then correlation analyses were performed between the new parameters and Ca2+ spark readouts, n = 136 atrial myocytes isolated from 10 mice (5 WT and 5 R2474S)
-
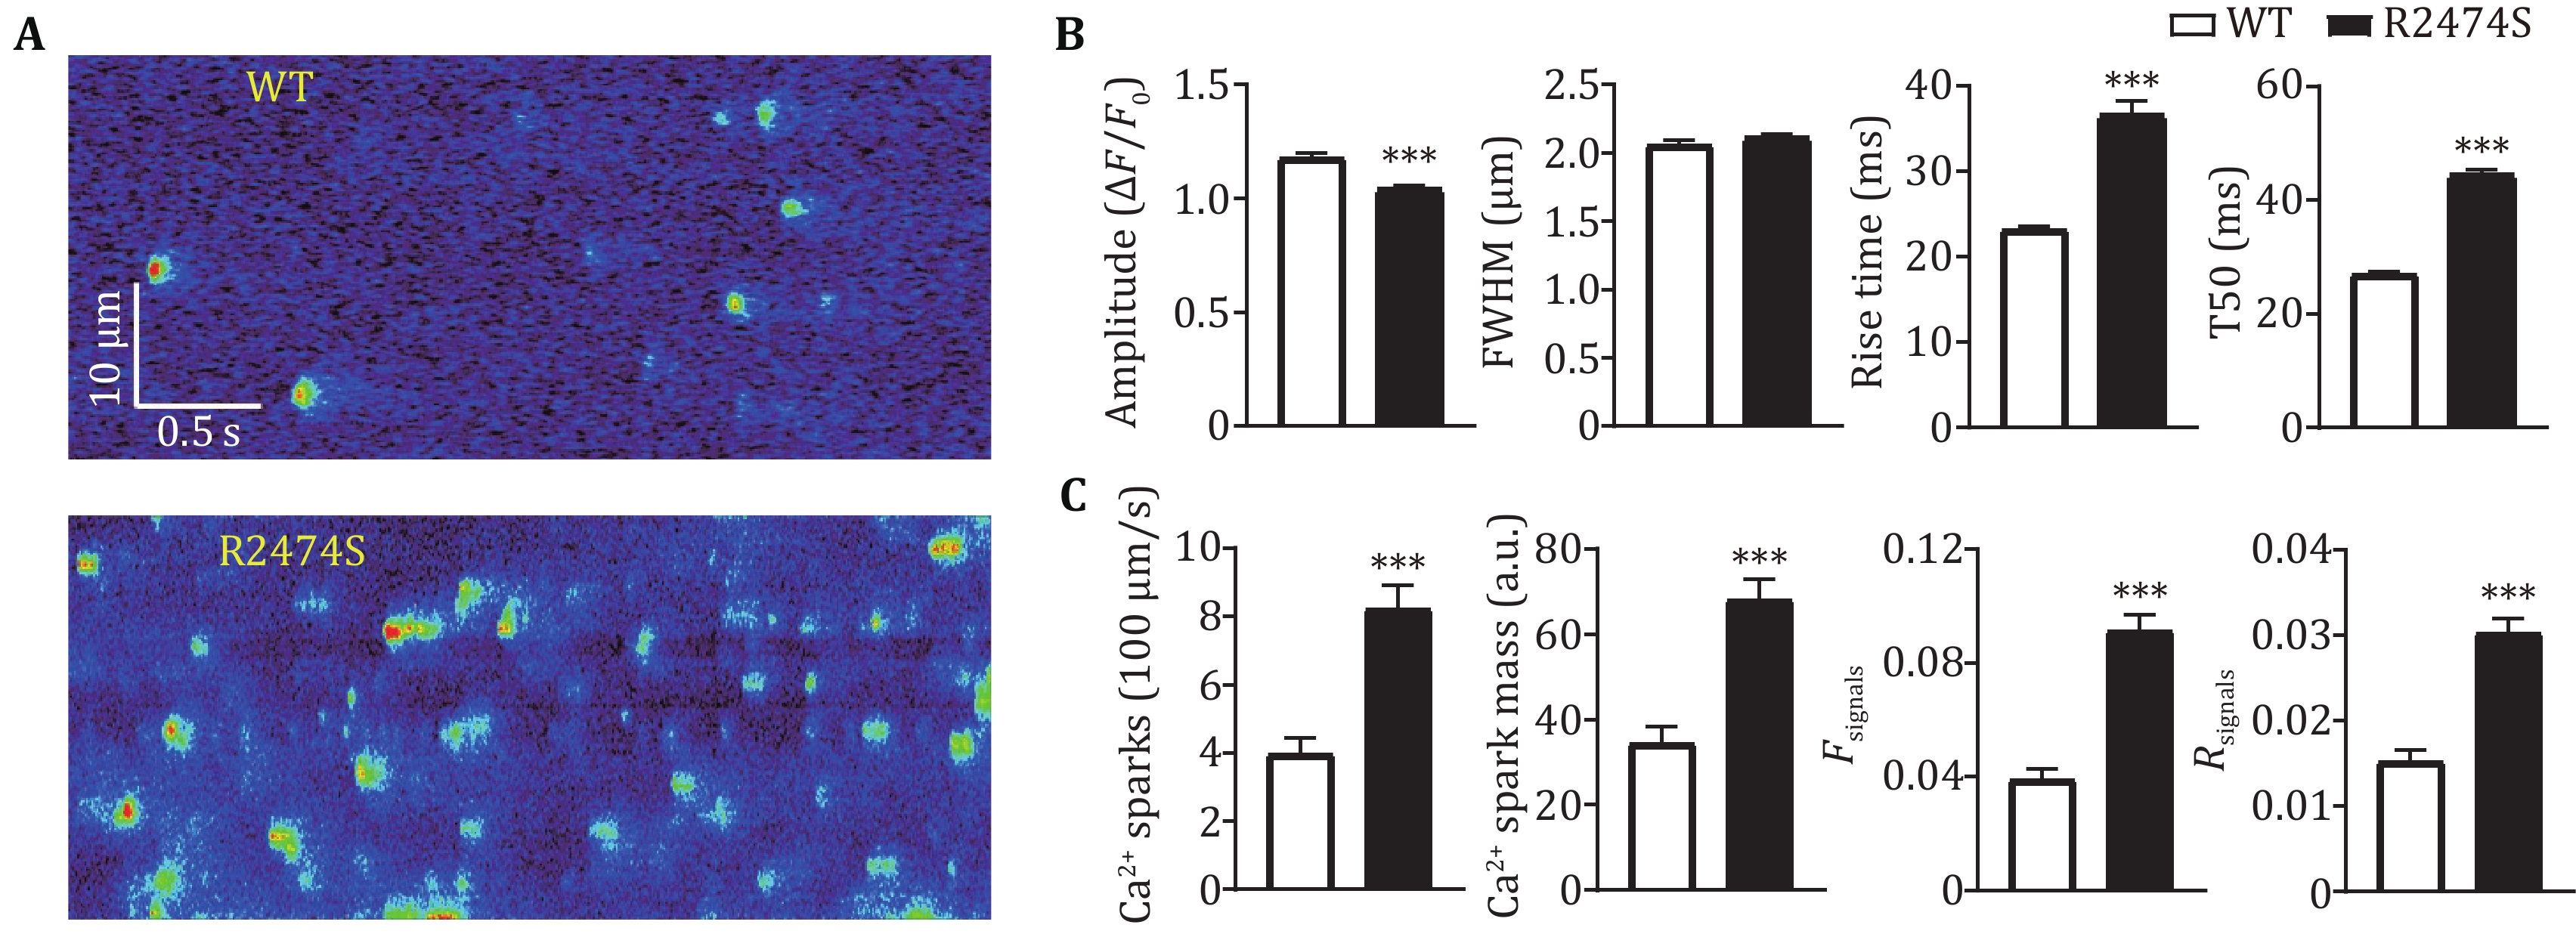
Figure 3. Comparison of SR Ca2+ leak in atrial myocytes from WT and R2474S mice with the new parameters and Ca2+ spark readouts. A Representative confocal line-scan Ca2+ images acquired from atrial myocytes of the WT and R2474S mice. B Statistics of spatiotemporal characteristics of Ca2+ sparks in atrial myocytes of both groups, n > 1000 events/group. Statistical significance was determined by unpaired t-test. C Statistics of new parameters as well as Ca2+ spark readouts in atrial myocytes of both groups. For the WT group, n = 45 cells from 5 mice; for the R2474S group, n = 30 cells from 5 mice. Statistical significance was determined by unpaired t-test
Figure
3 ,Table
0 个