-
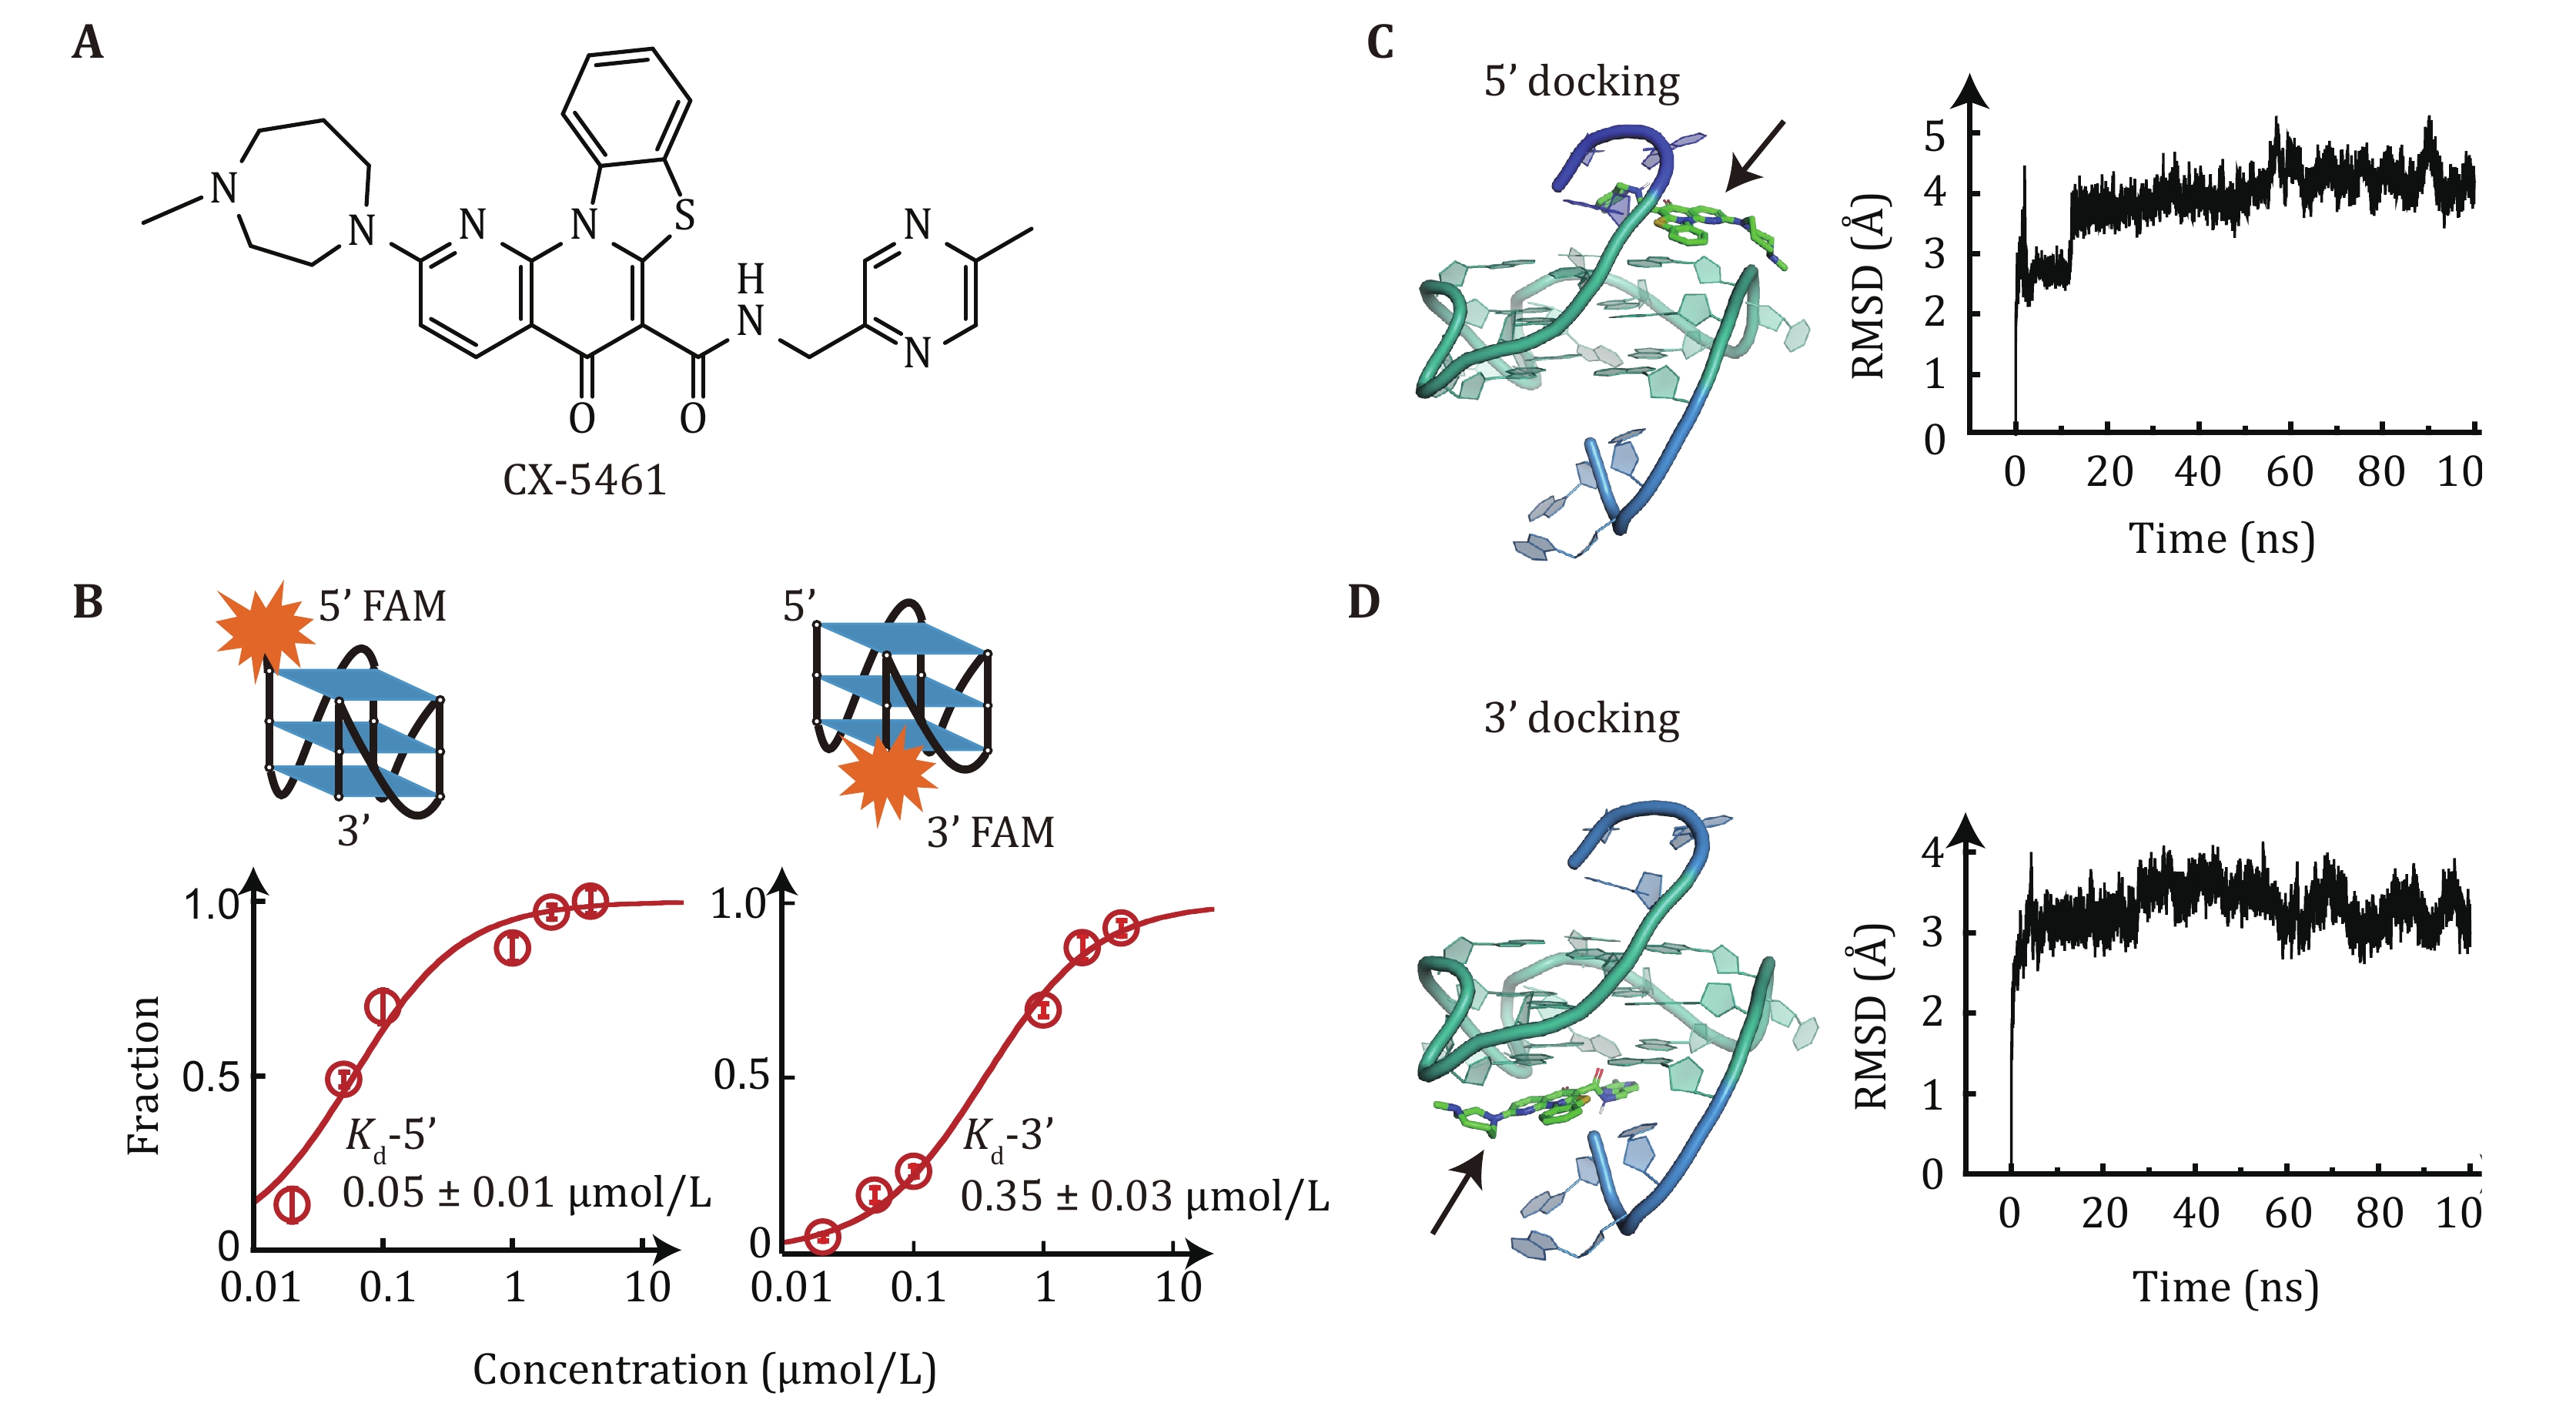
Figure 1. Binding affinity of CX-5461 to c-MYC G4s. A Chemical structure of CX-5461. CX-5461 contains a rigid benzothiazole-based core region and two flexible side chains. B Dissociation constant Kd of CX-5461 binding to 5'-FAM-MYC G4 or 3'-FAM-MYC G4 determined by fluorescence quenching assay. The data points represent the average of three replicates, with error bars indicating the standard error. C,D Molecular docking simulations. Left panel: the lowest-energy binding conformations of CX-5461 docked to the 5'-end (C) and 3'-end of G4s (D). The BMVC c-MYC G4 complex (PDB ID:6O2L) was used for semi-flexible global docking. Right panel: root means square deviation (RMSD) of the CX-5461-G4 complexes during a 100 ns molecular dynamics simulation. The RMSD values remained below 0.5 nm, suggesting the initial docking poses were valid
-
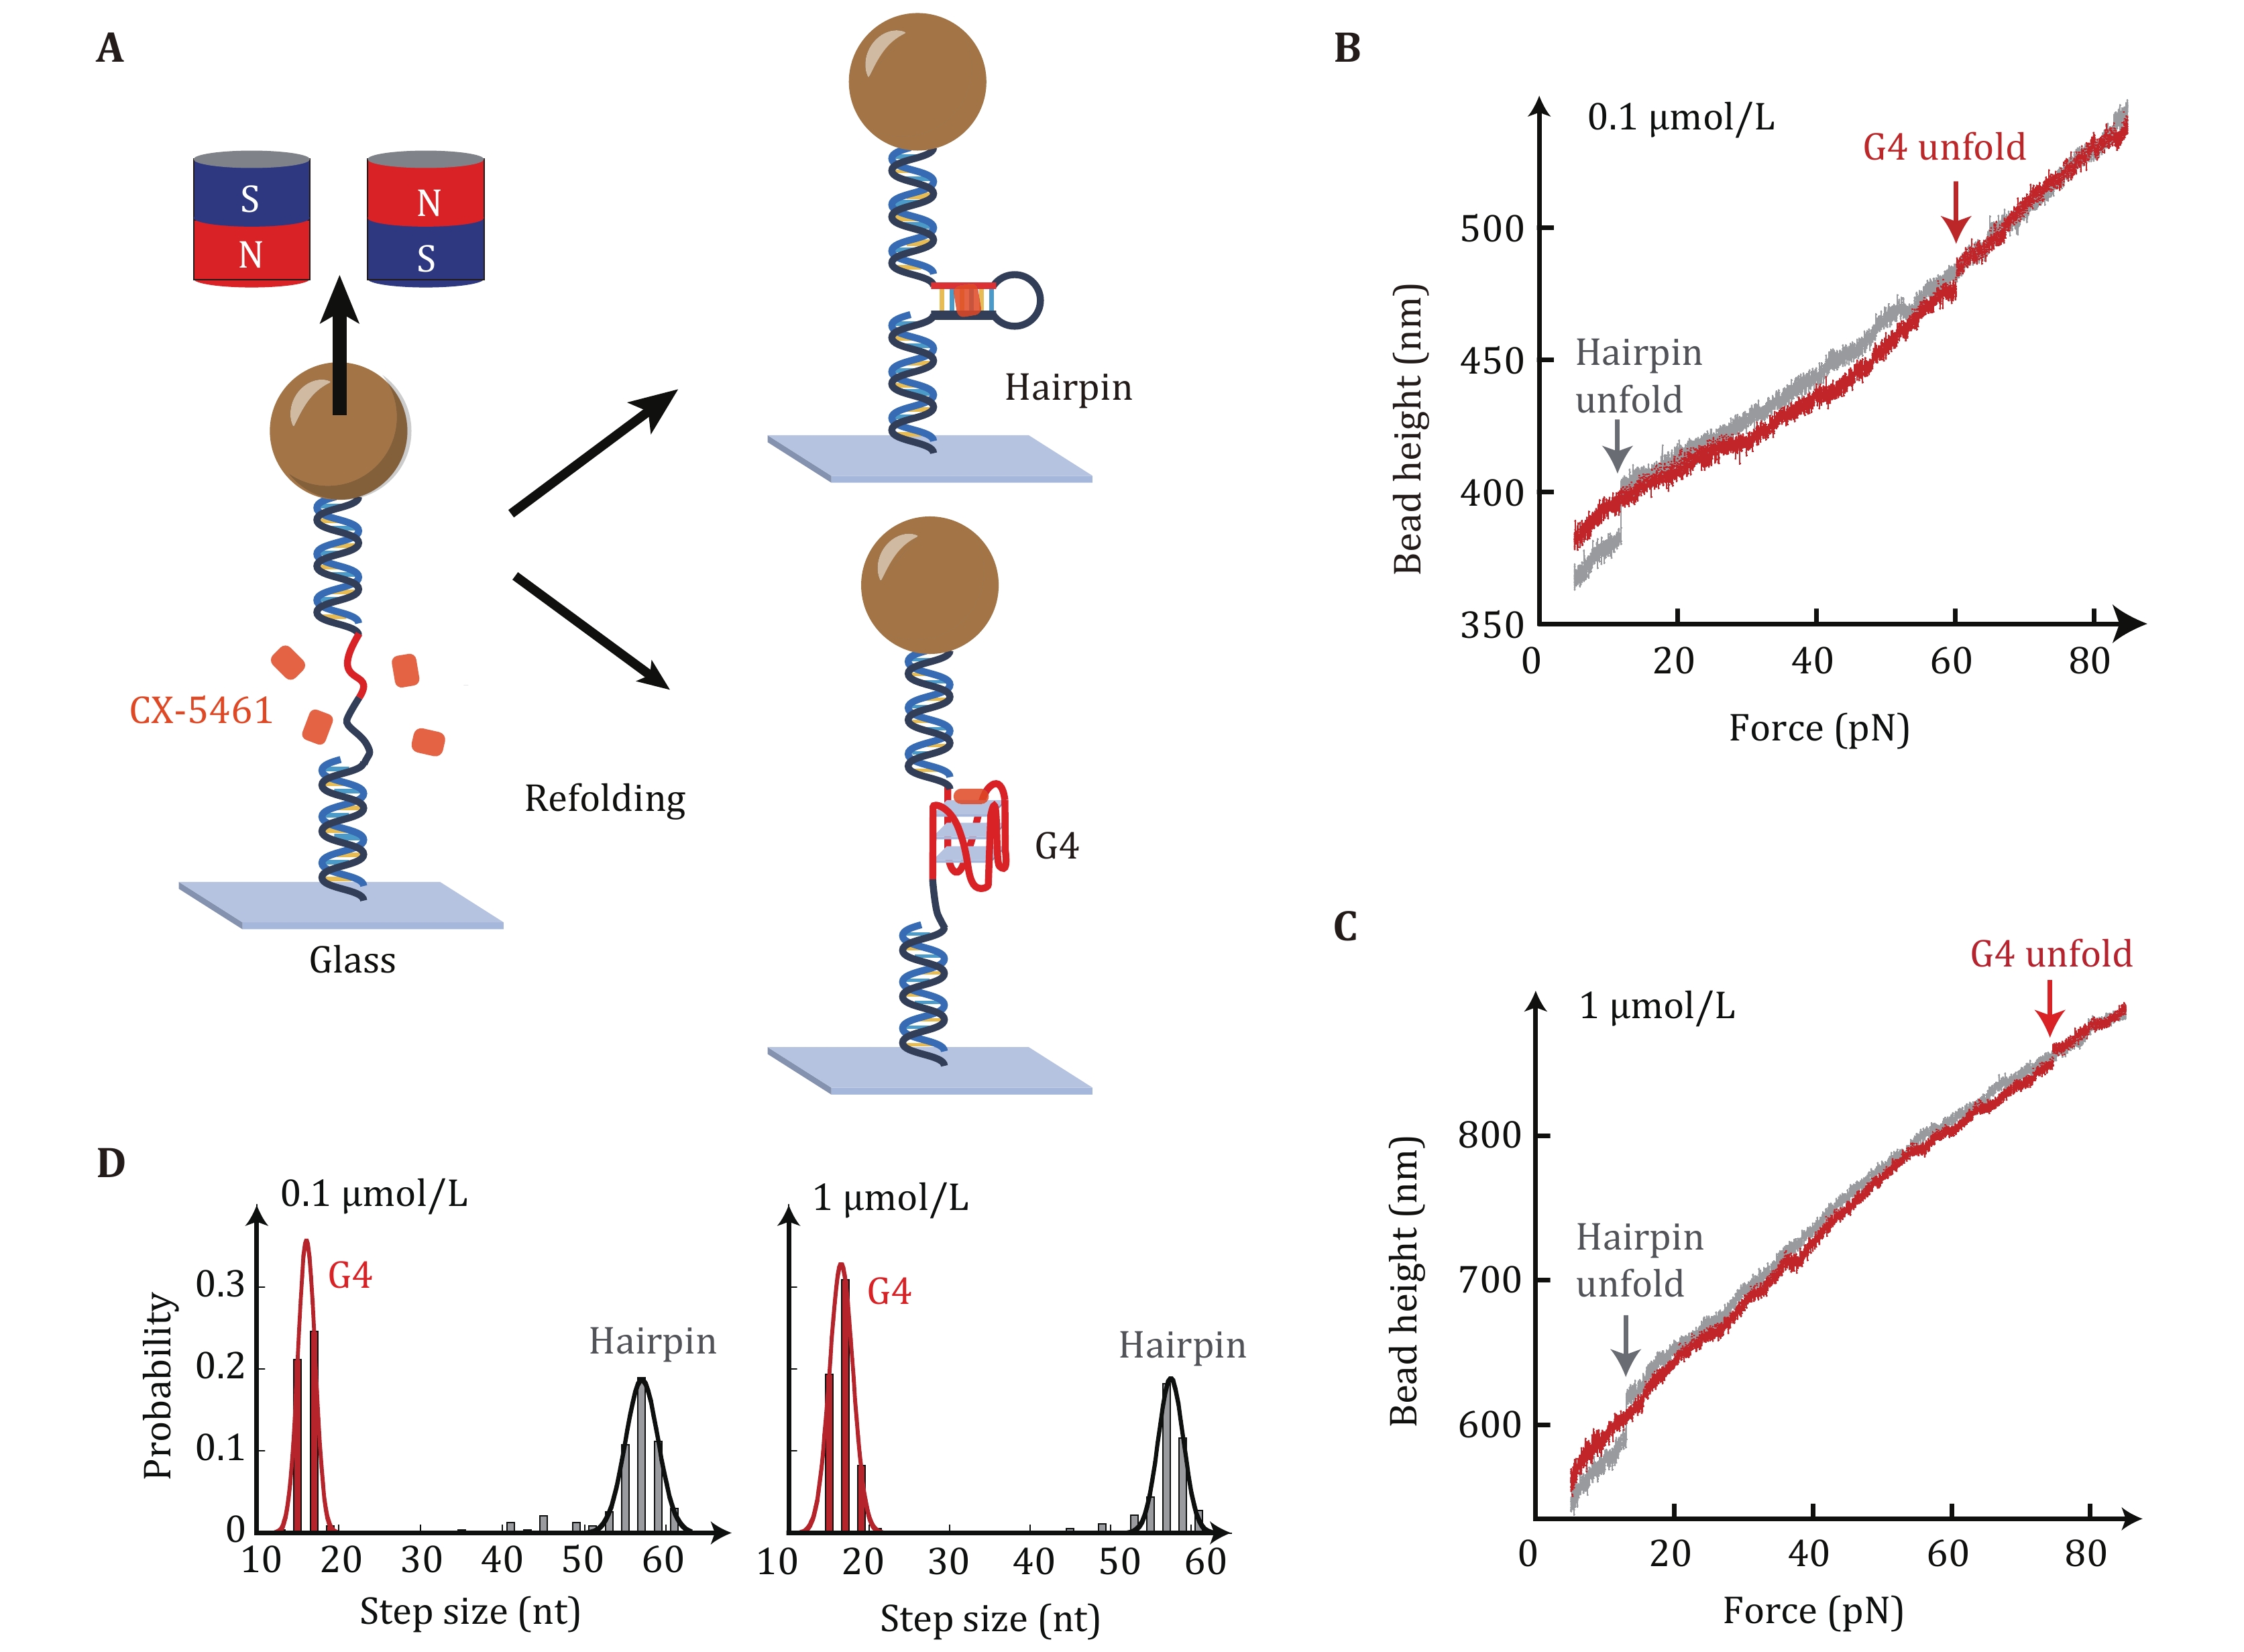
Figure 2. Single-molecule magnetic tweezers measurements for unfolding forces of c-MYC G4s in the presence of CX-5461. A Schematic of the experimental setup. A G4-forming sequence (red) and the complementary strand (black) spaced with a 20 nt thymine loop (Myc-20T) are ligated with two dsDNA handles (489 bp and 609 bp). The DNA construct is attached to a paramagnetic bead through biotin-streptavidin and a coverslip through a covalent cross-linker at each end. B,C The overlap of the force-extension curve of MYC-hairpin (grey) and MYC-G4 (red) in the presence of 0.1 µmol/L (B) and 1 µmol/L (C) CX-5461. D Unfolding step size analysis of Myc-20T G4s in the presence of 0.1 µmol/L CX-5461 (n = 232, left panel) and 1 µmol/L CX-5461 (n = 181, right panel). Data were fitted with Gaussian distribution
-
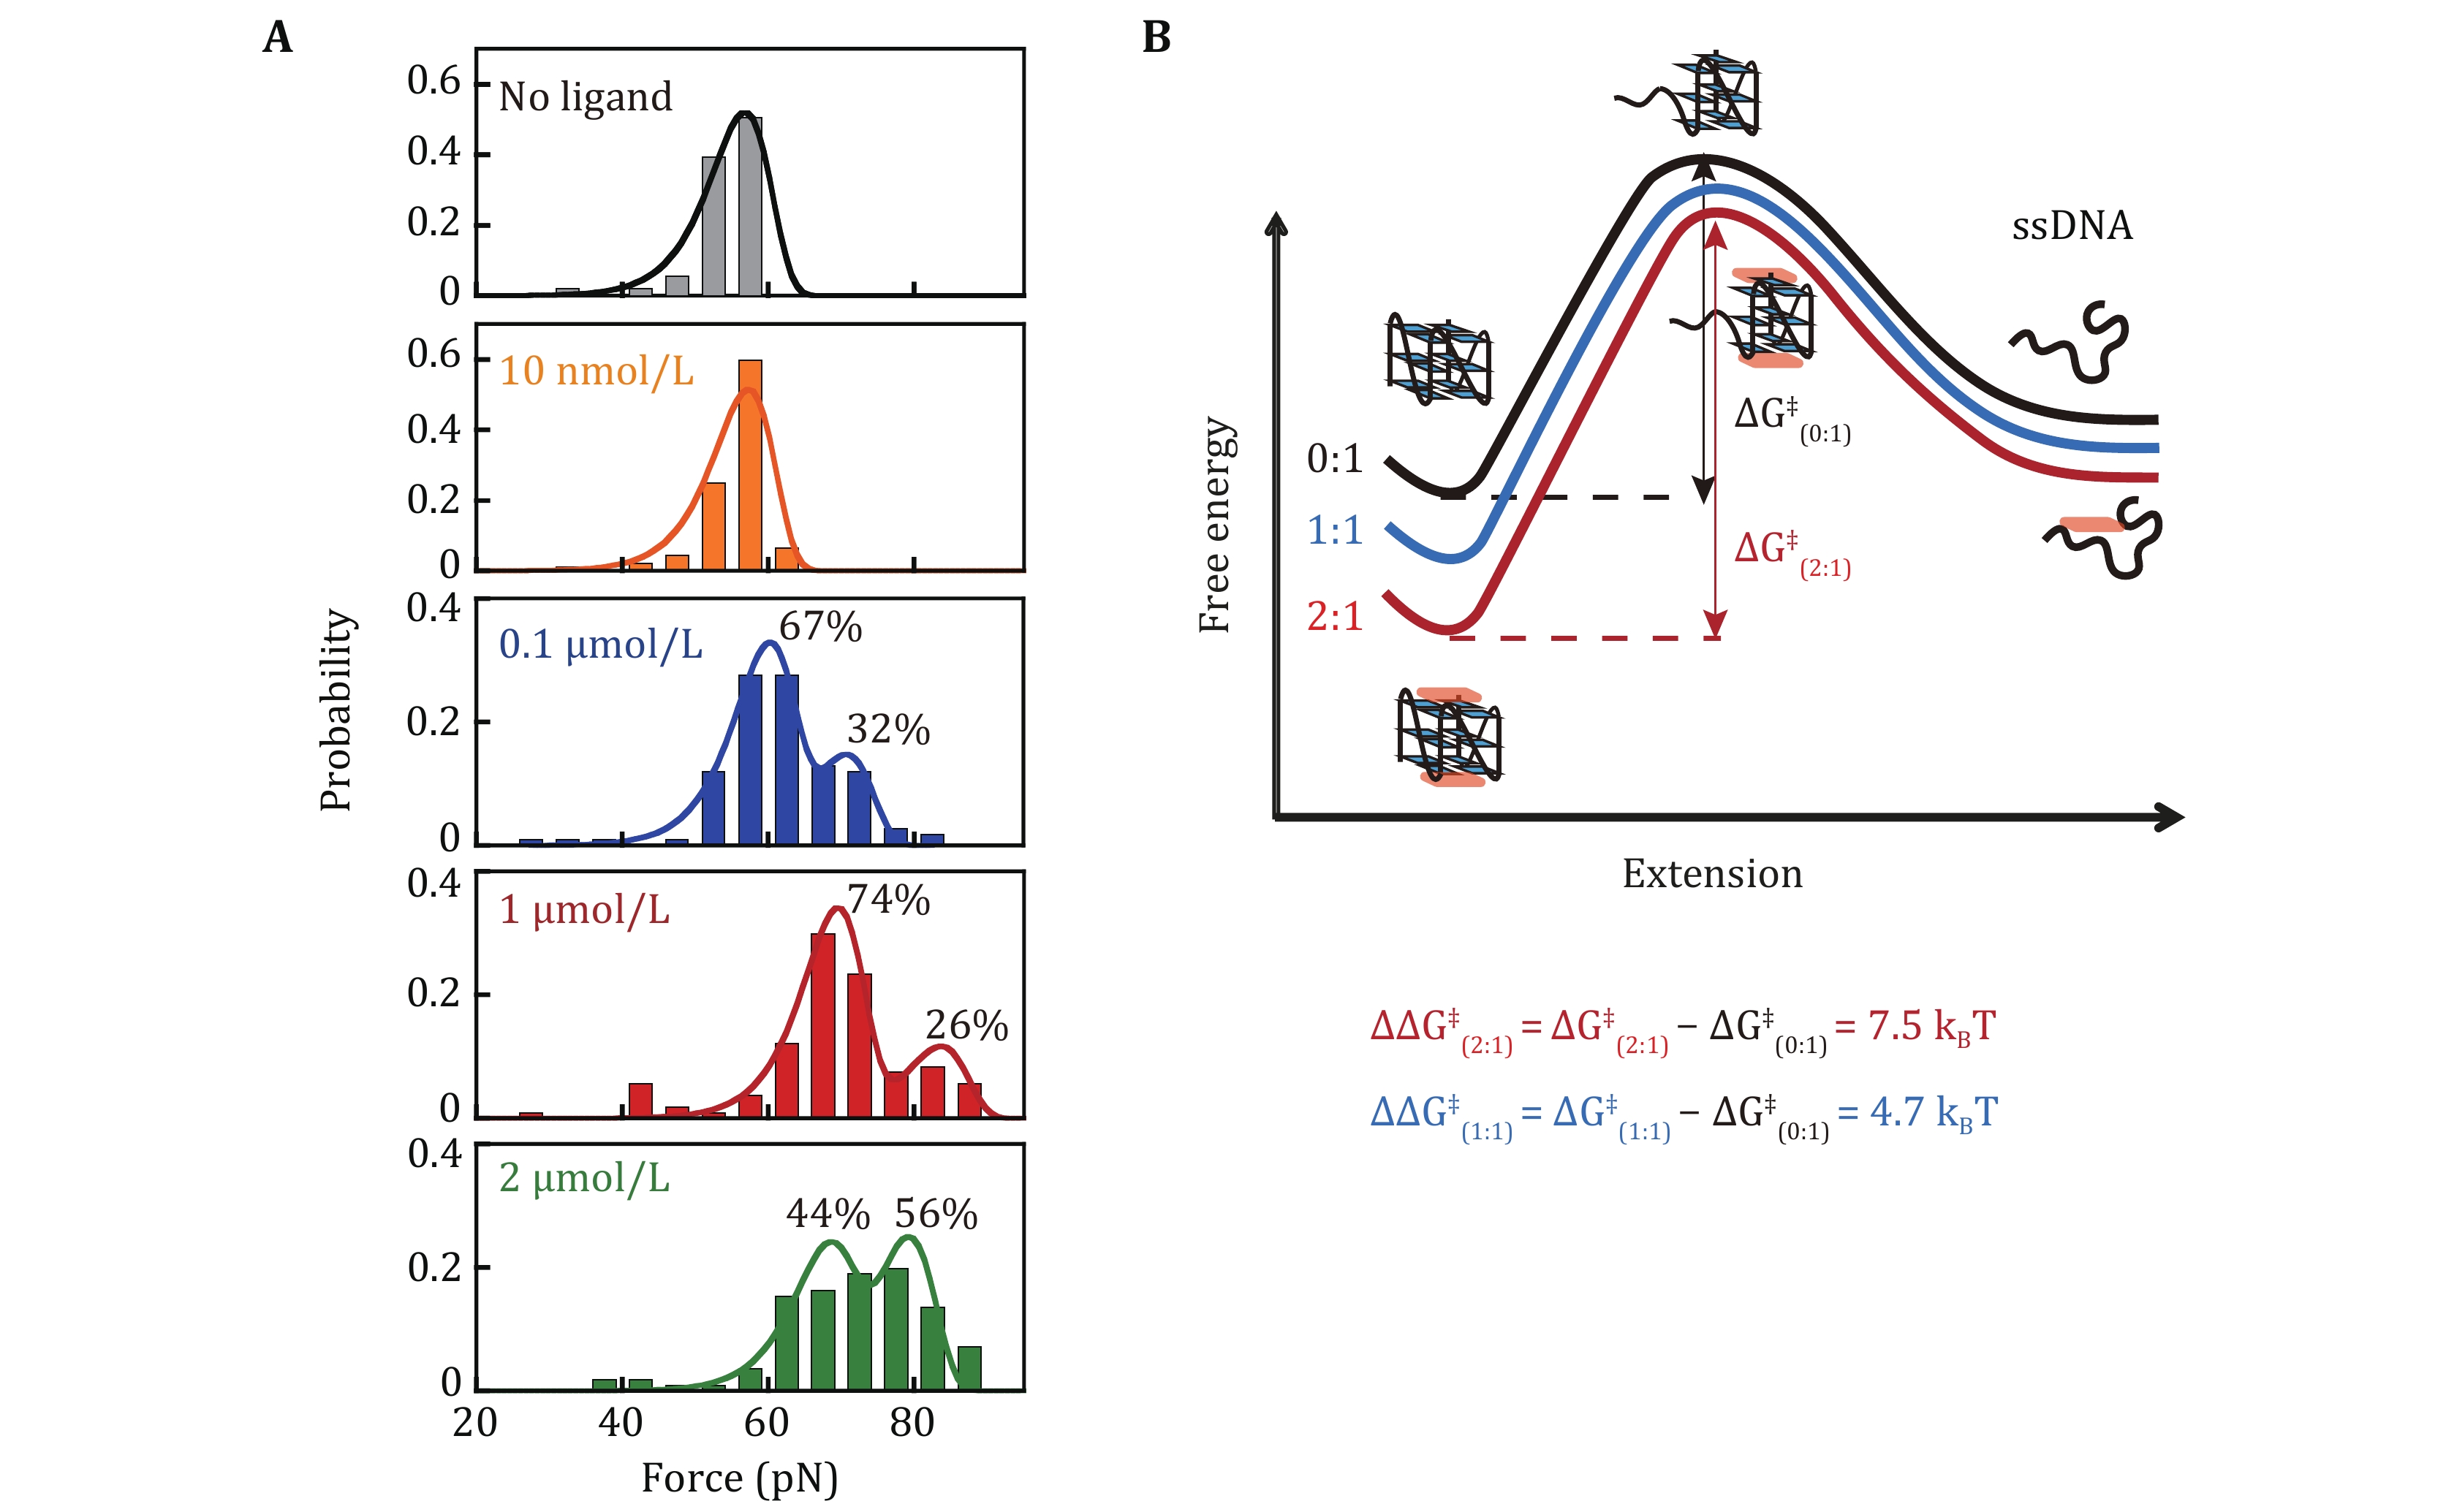
Figure 3. Unfolding force distribution of c-MYC G4s in the presence of CX-5461. A Unfolding force distributions of c-MYC G4s in the absence and presence of different concentrations of CX-5461. The data obtained at 0 nmol/L (grey) and 10 nmol/L CX-5461 (yellow) were fitted with a single peak using the Bell-Arrhenius model (Eq. 2). The data obtained at 0.1 μmol/L (blue), 1 µmol/L (red), and 2 µmol/L (green) CX-5461 were fitted with two peaks using the Bell-Arrhenius model. B Energy landscape reconstruction. The change of activation energy was calculated using
$ \Delta {\mathit{G}}^{\text{‡}} $ and using$ {\mathit{k}}_{\mathit{u}}^{0}=\mathit{A}\mathbf{exp}\left(\dfrac{-\Delta {\mathit{G}}^{\text{‡}}}{{\mathit{k}}_{\mathit{B}}\mathit{T}}\right) $ assuming that ligands do not significantly change the prefactor A
Figure
3 ,Table
1 个