-
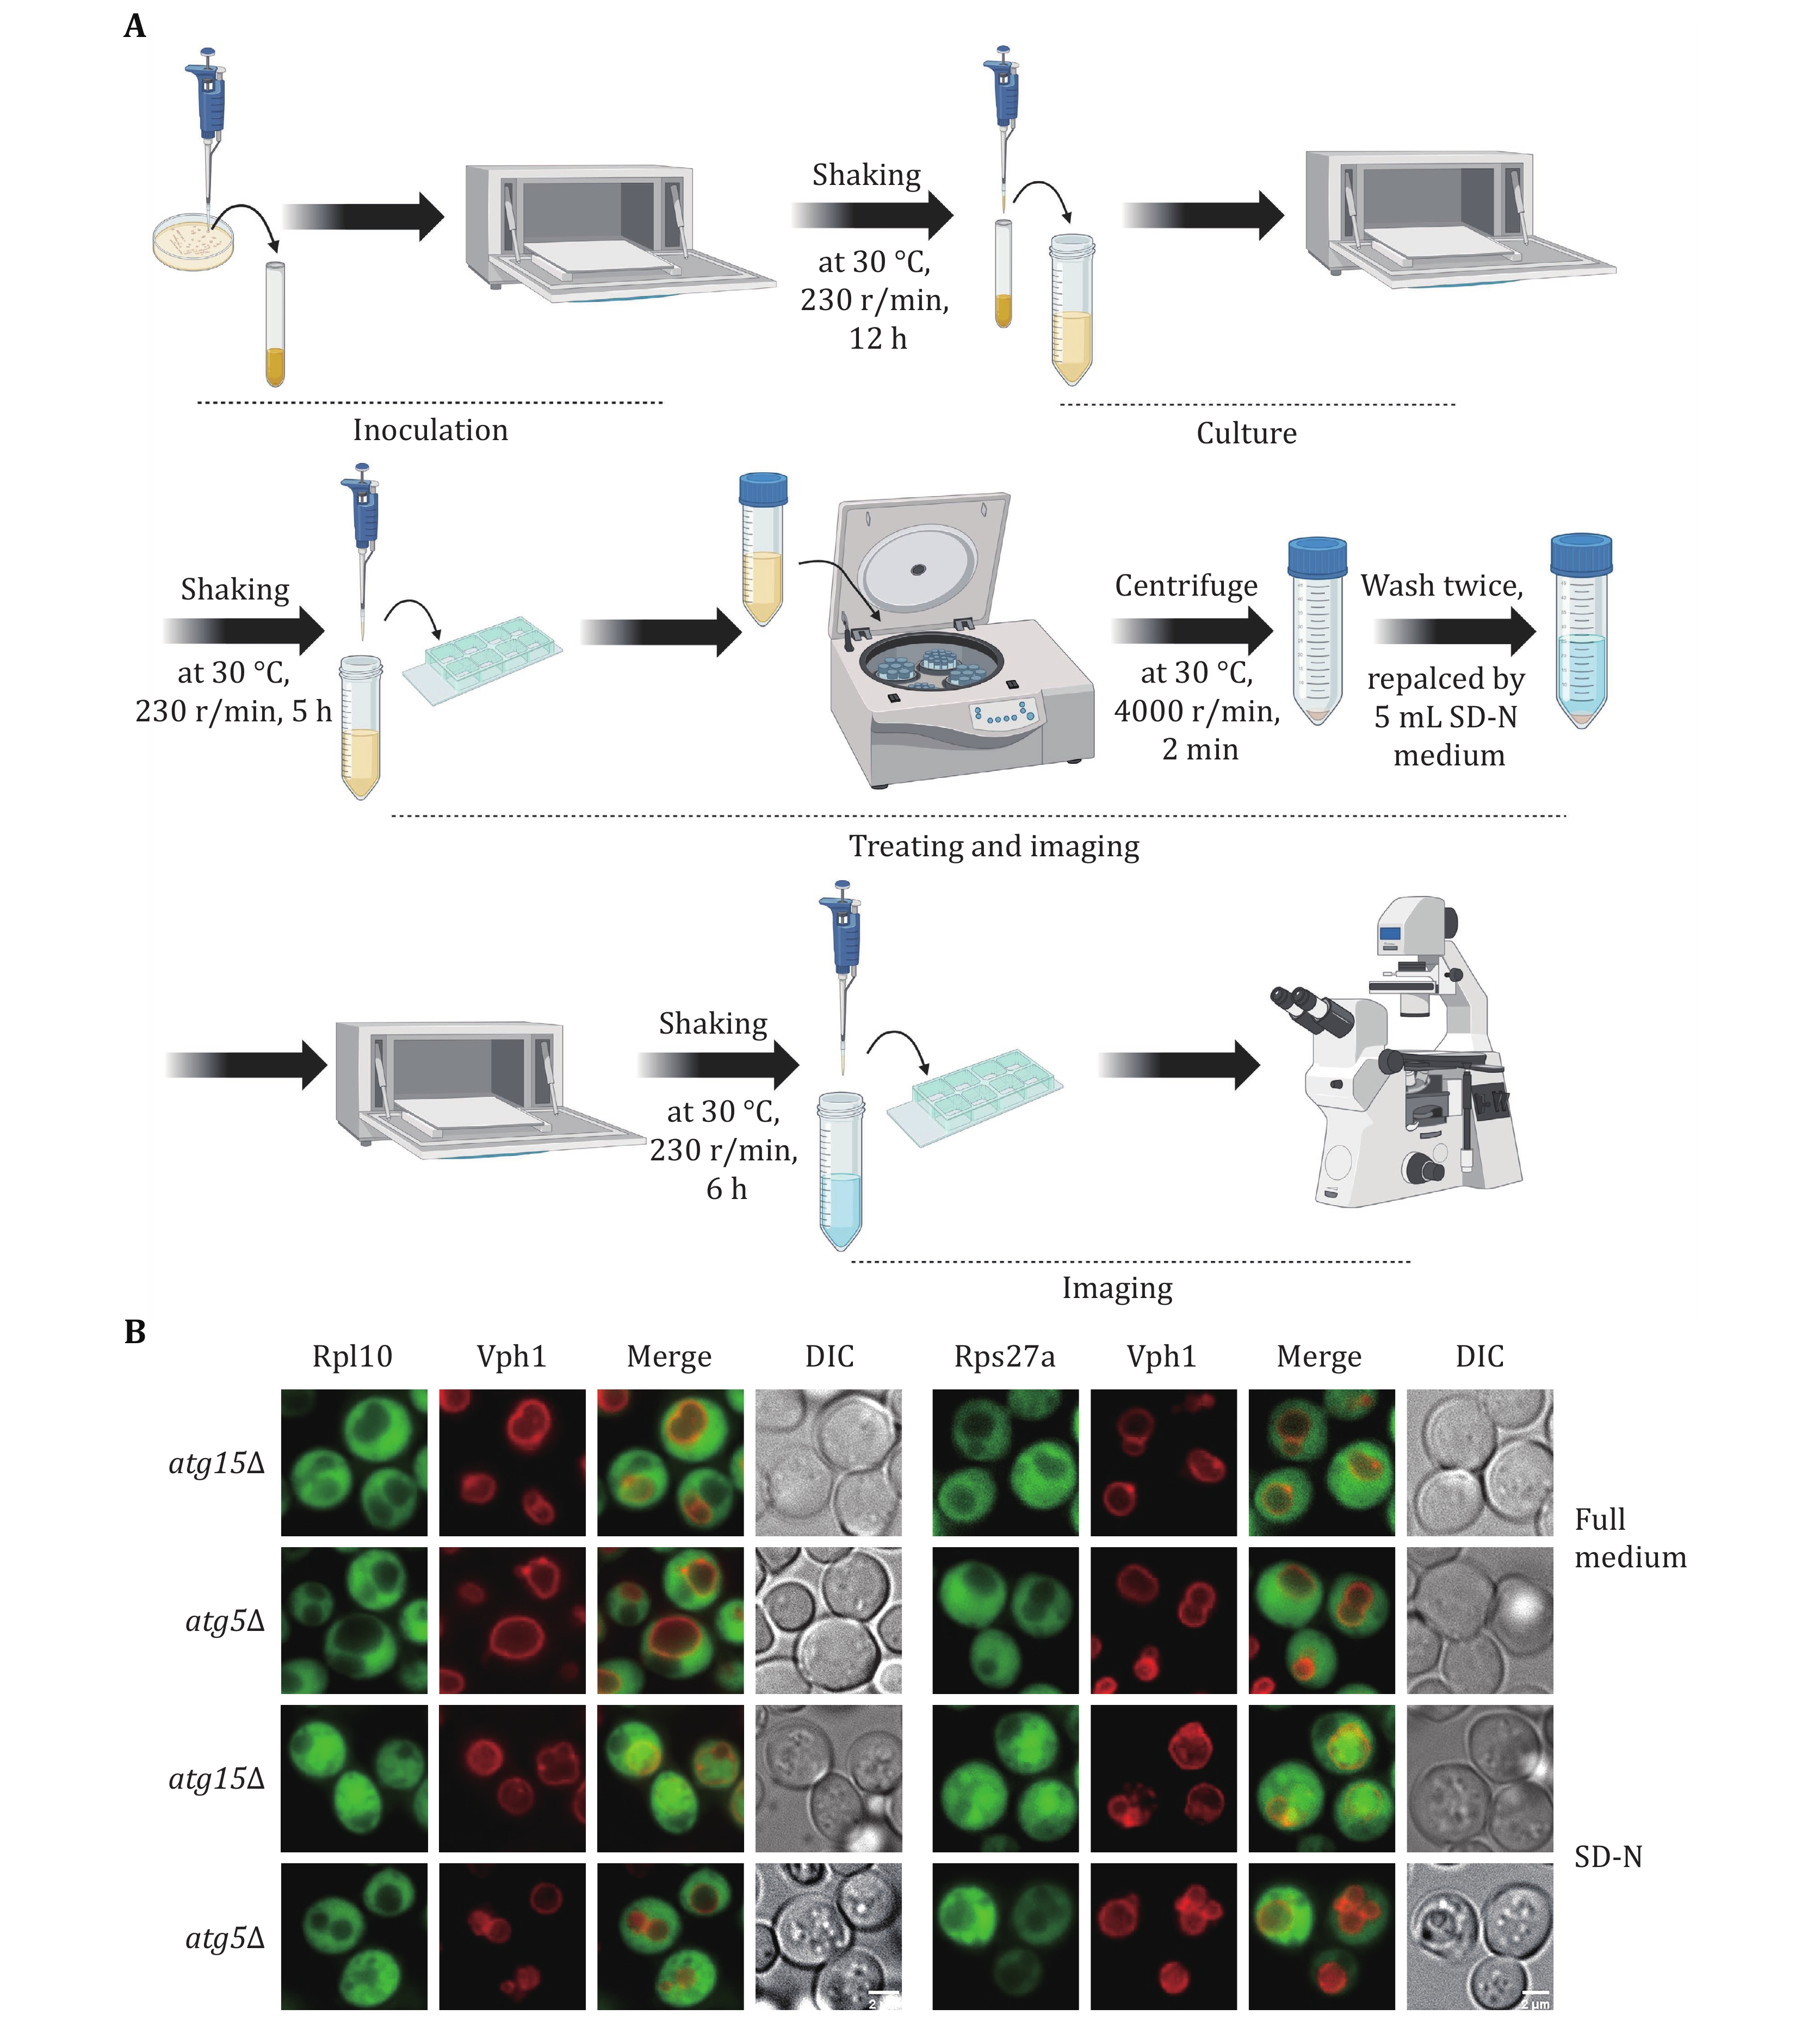
Figure 1. Detecting yeast ribophagy using a fluorescence microscope. A Operating procedures for yeast ribophagy using a fluorescence microscope. B atg15Δ or atg5Δ yeast strains co-expressing Vph1-mCherry along with either Rpl10-GFP or Rps27a-GFP were subjected to SD-N for 0 or 6 h. Images of cells were obtained using fluorescence microscopy. Scale bar, 2 μm
-
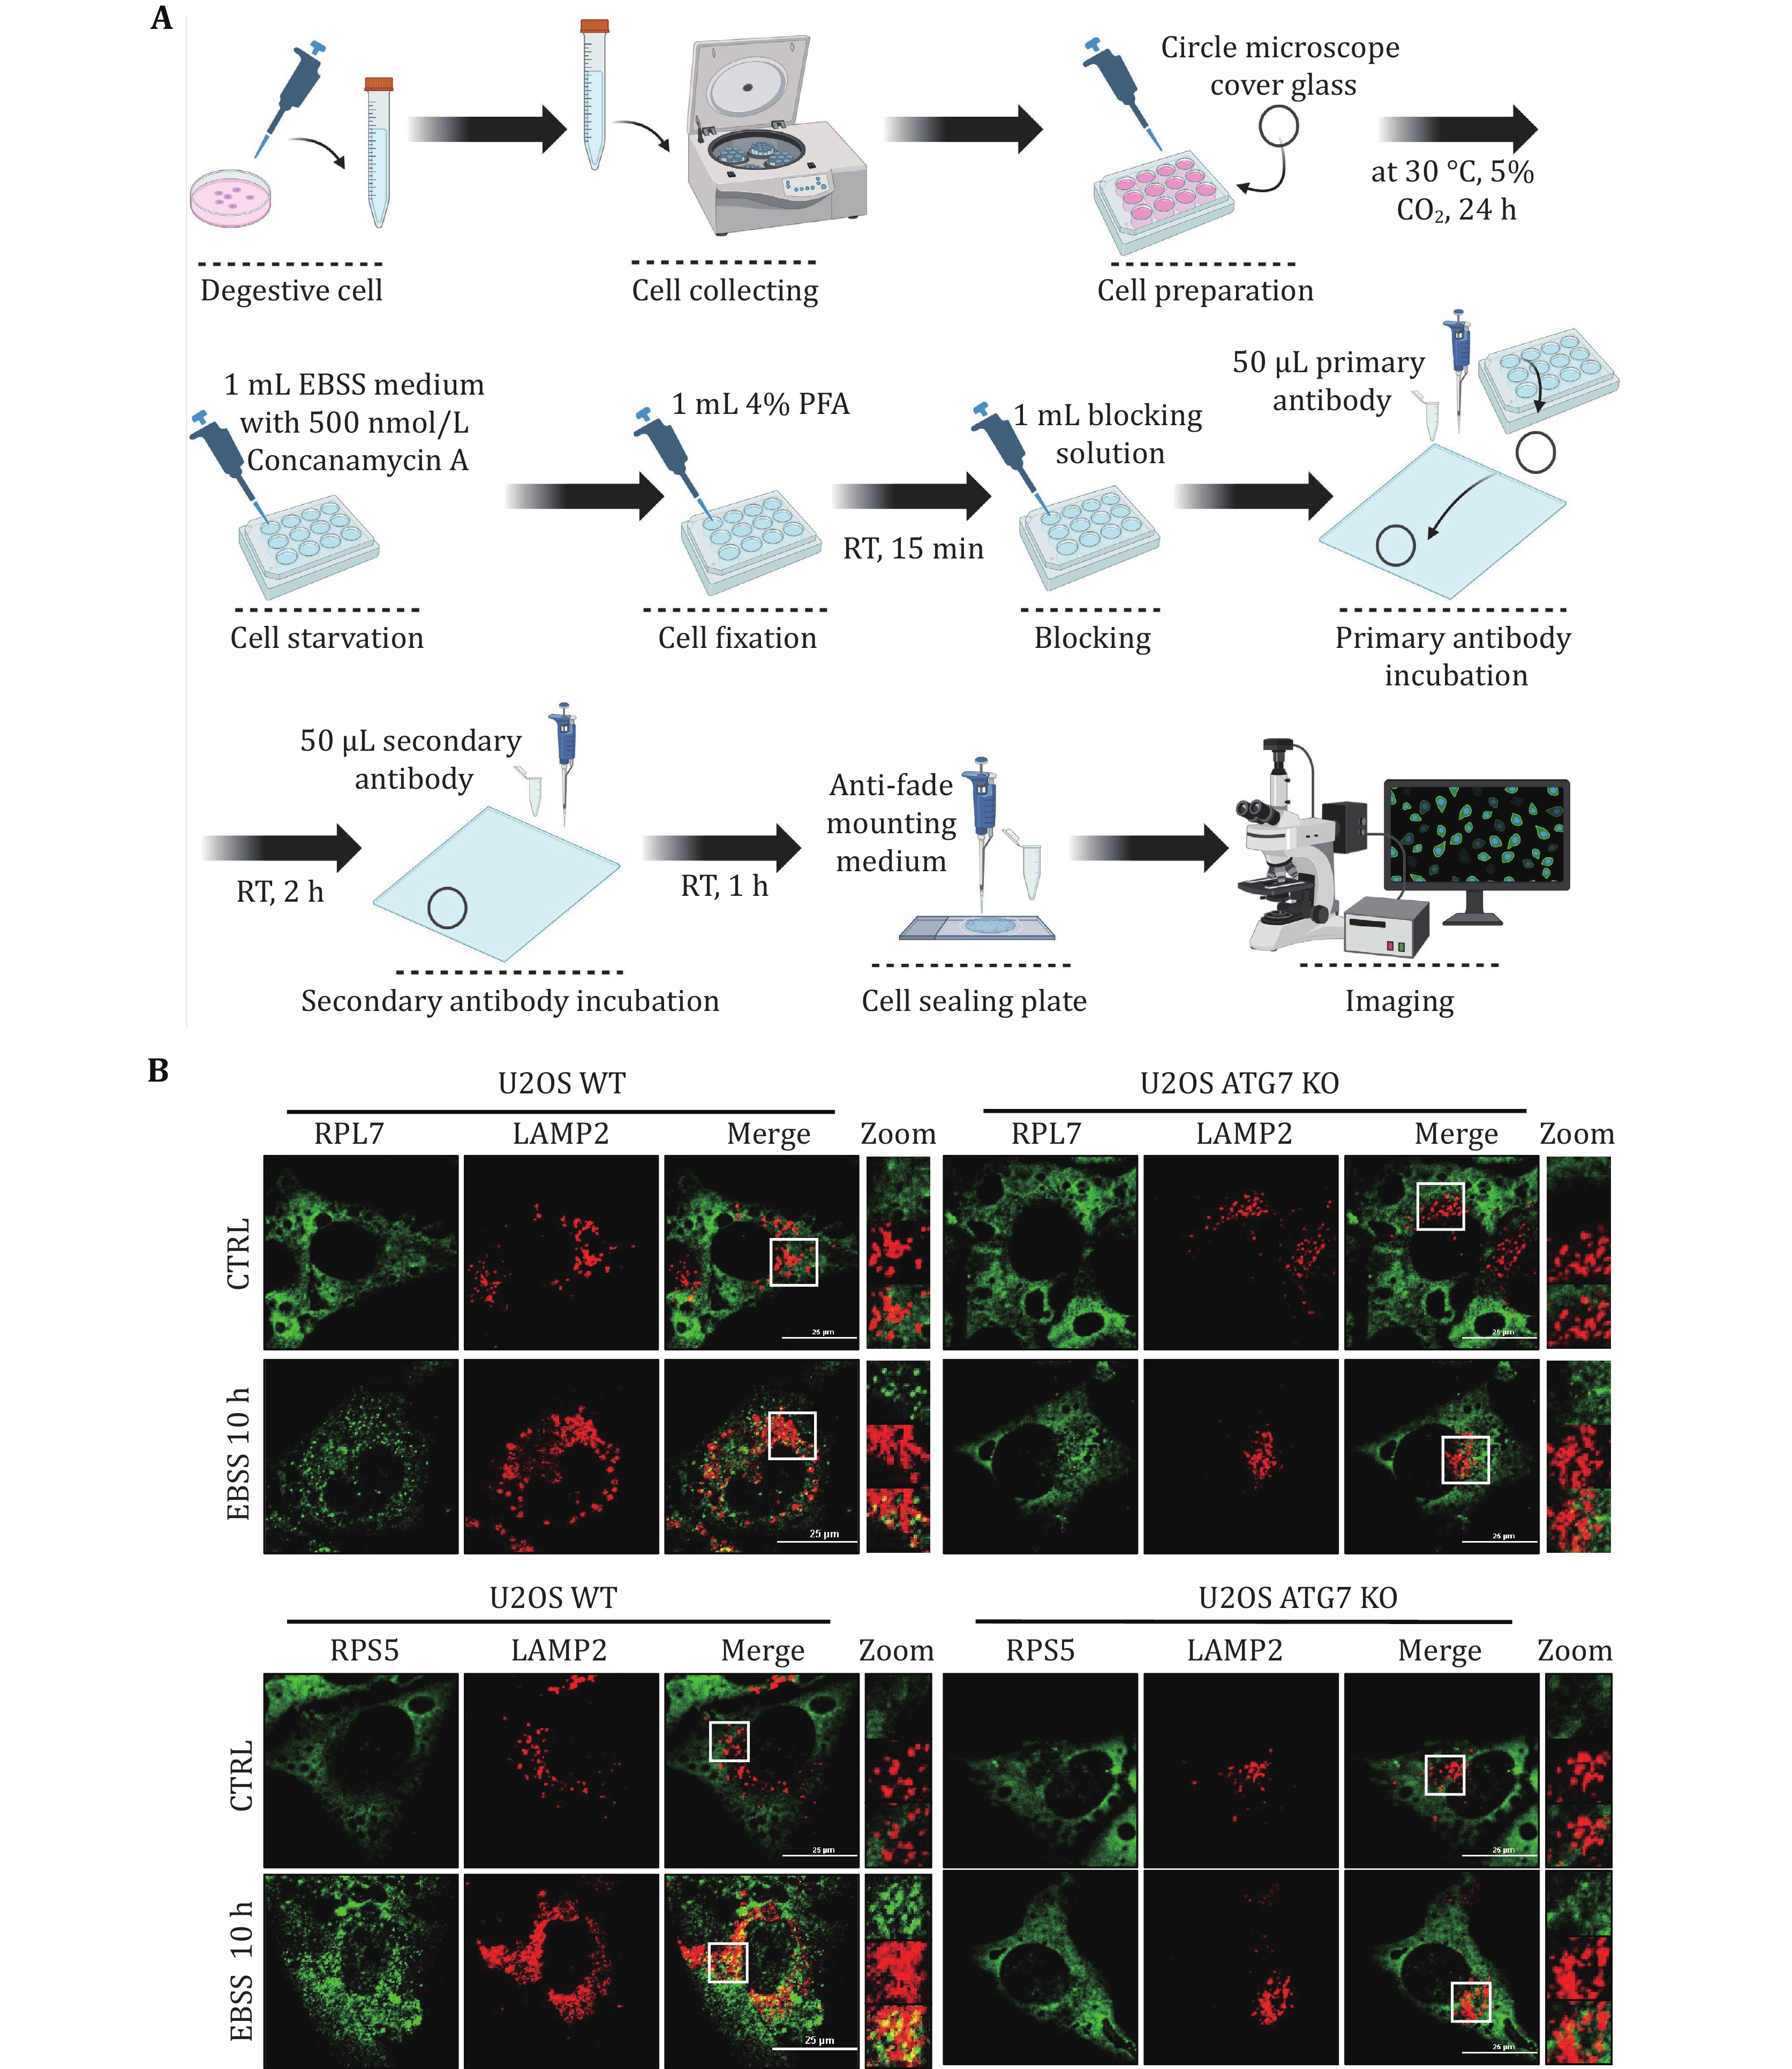
Figure 2. Detecting mammalian ribophagy using a confocal laser scanning microscope. A Operating procedures for mammalian ribophagy using a confocal laser scanning microscope. B Immunofluorescence staining of lysosomal marker LAMP2 (red) combined with either the ribosome's large subunit RPL7 (green) or the small subunit RPS5 (green), both with EBSS treatment for 10 h, in U2OS WT or ATG7 KO cells. Images of cells were obtained using a confocal laser scanning microscope. Scale bar, 25 μm
-
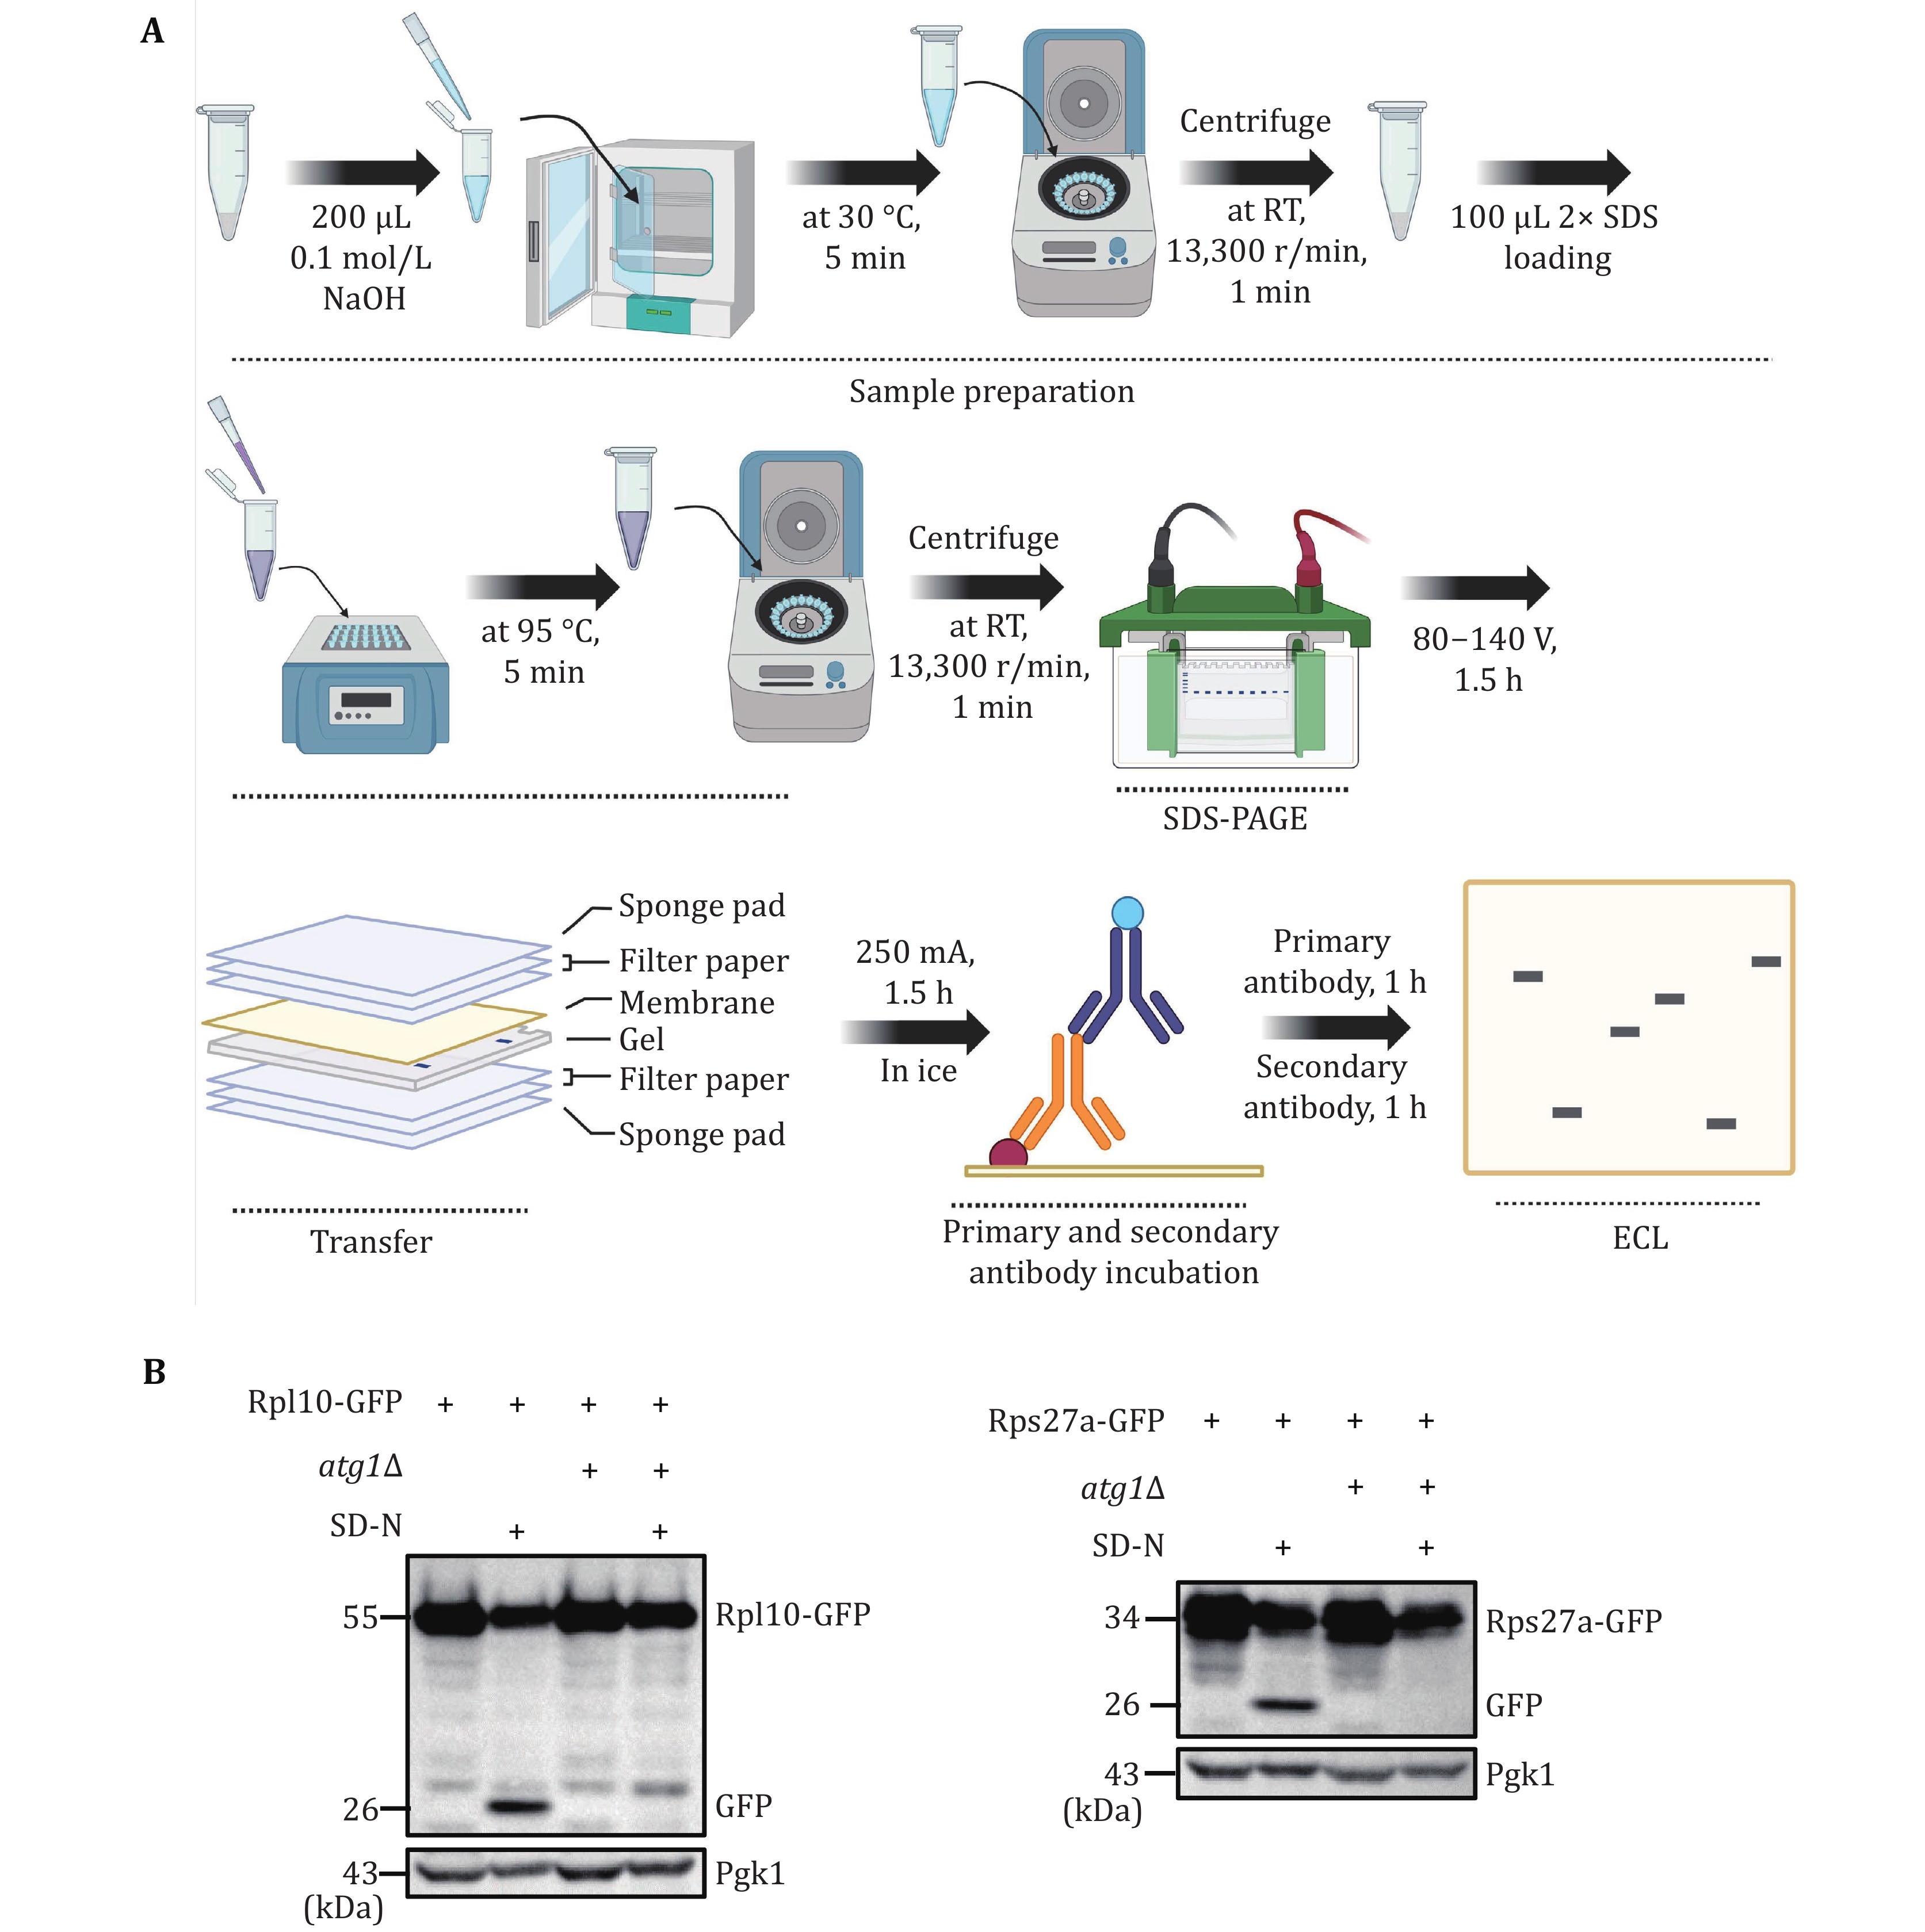
Figure 3. Validating yeast ribophagy by Western blot analysis. A The flowchart for validating yeast ribophagy through Western blot analysis. B Wild-type (BY4741) or atg1∆ yeast cells expressing Rps27a or Rpl10 tagged with GFP were cultured until reaching the logarithmic phase. Subsequently, they were subjected to nitrogen starvation for 0 or 6 h. The GFP cleavage of the specified fusion proteins was detected using an anti-GFP antibody. Pgk1 served as the loading control
-
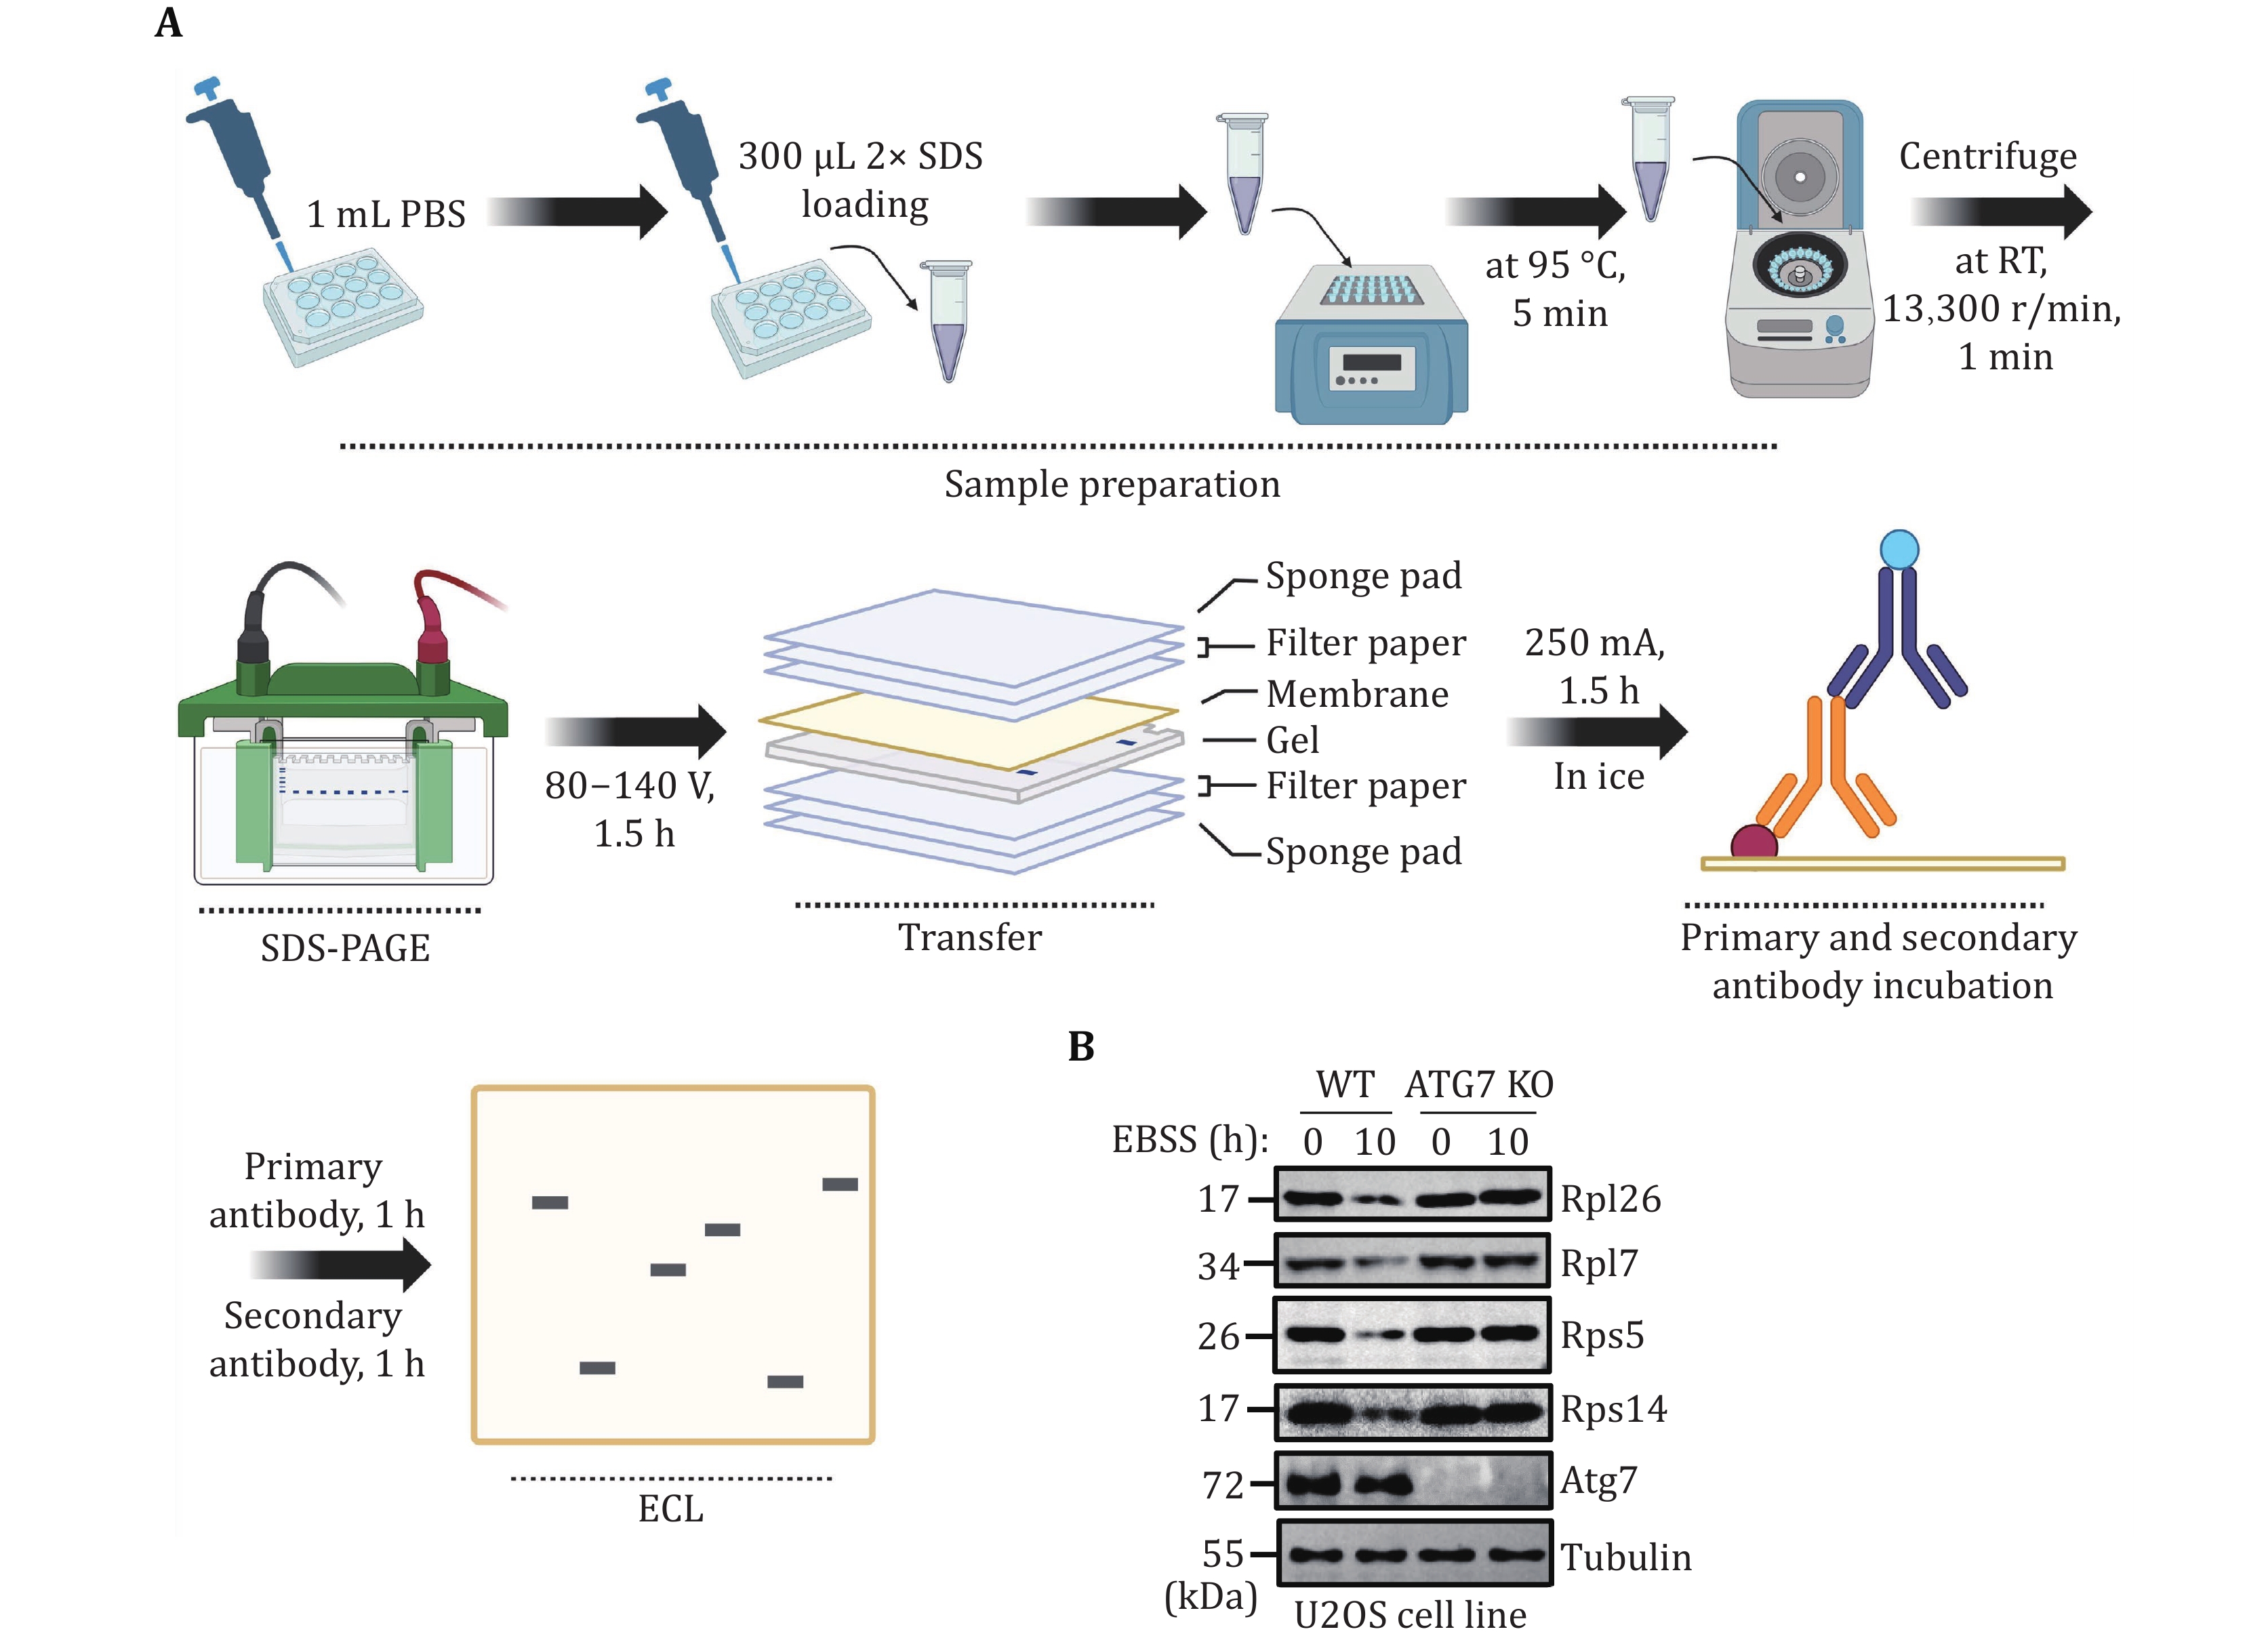
Figure 4. Validating mammalian ribophagy by Western blot analysis. A The flowchart for validating mammalian ribophagy through Western blot analysis. B U2OS WT or ATG7 KO cells were starved with EBSS for 0 or 10 h. The degradation of the specified ribosomal proteins was detected using their corresponding antibodies. Tubulin served as the loading control
-
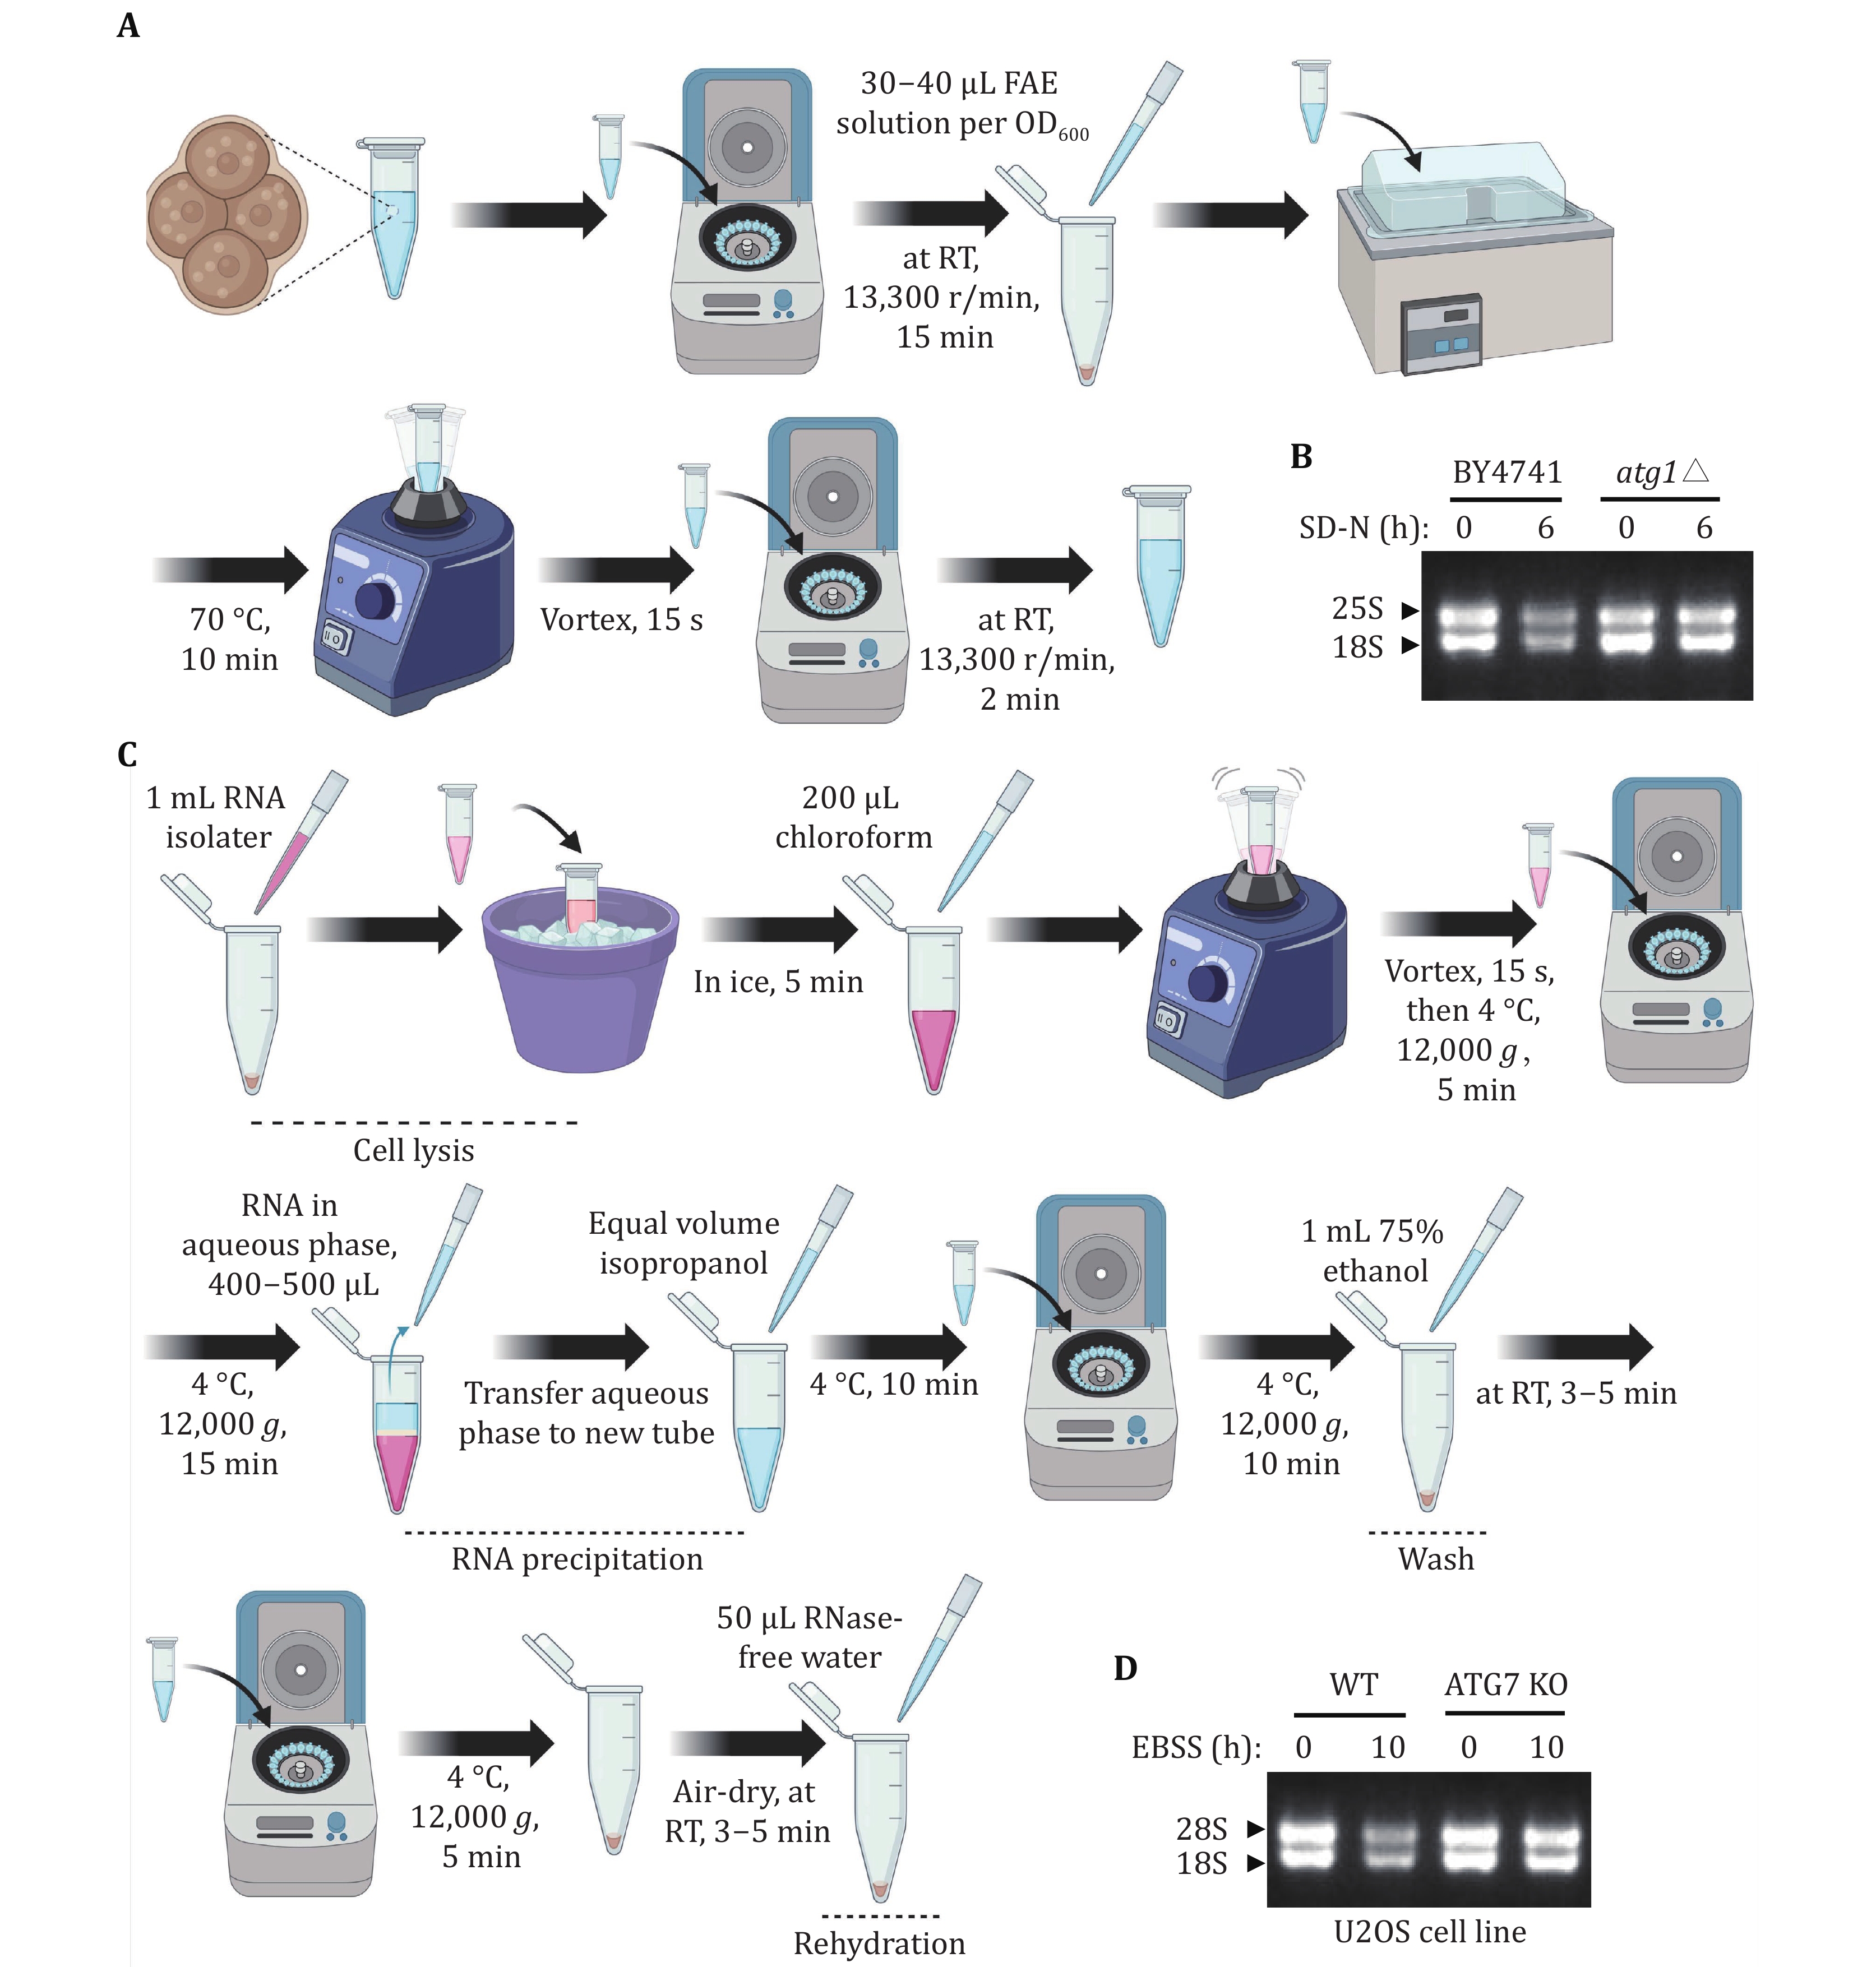
Figure 5. Assessing yeast and mammalian ribophagy through rRNA analysis. A The flowchart depicting the process of yeast RNA extraction. B Wild-type (BY4741) or atg1∆ cells were cultured until reaching the logarithmic phase. Subsequently, they were subjected to nitrogen starvation for 0 or 6 h. After collecting five OD600 yeast samples, RNA was extracted and a formaldehyde agarose gel was run. The arrow indicates the corresponding 25S and 18S rRNA, respectively. C The flowchart depicting the process of mammalian RNA extraction. D When the U2OS WT or ATG7 KO cells on the 6-cm dish reached a density of 90%, they were starved with EBSS for 0 or 10 h. Total RNA was extracted and a formaldehyde agarose gel was run. RNA from equal numbers of cells was loaded in each lane. The arrowhead indicates that the corresponding 28S and 18S rRNA, respectively
-
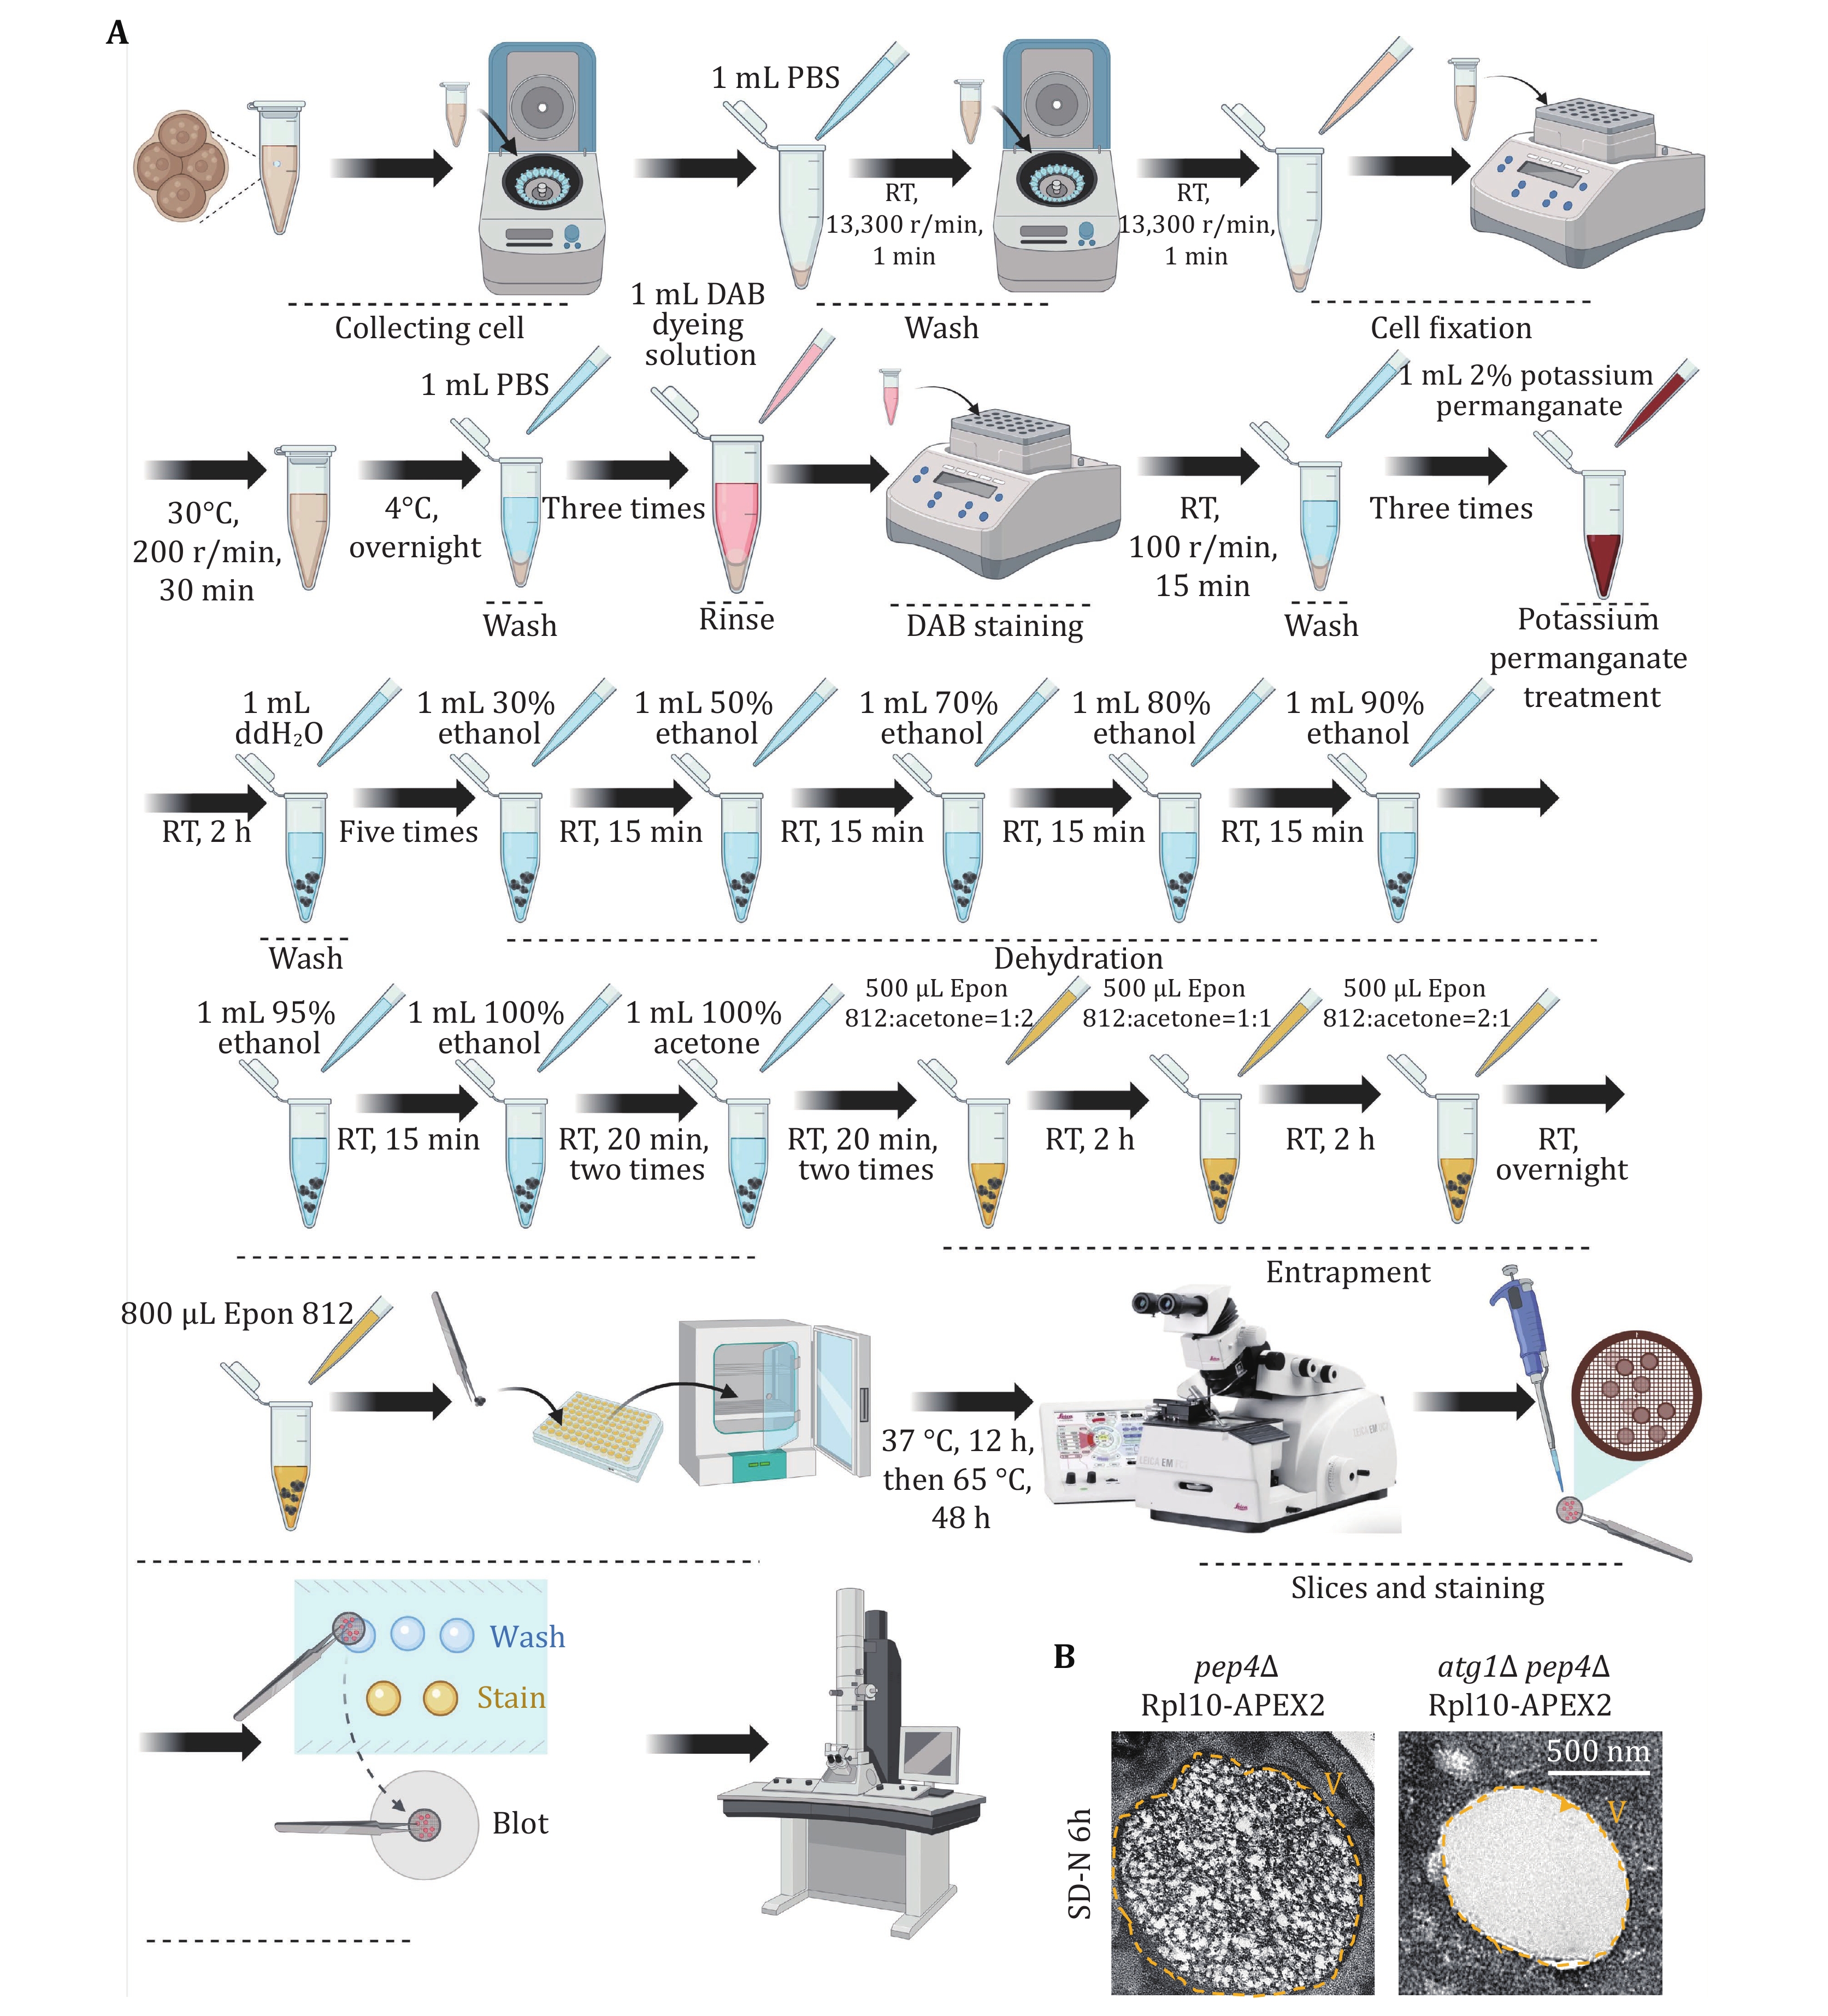
Figure 6. Detecting yeast ribophagy using TEM. A The flowchart illustrates the detection of yeast ribophagy using TEM. B pep4∆ or atg1∆-pep4∆ yeast cells expressing Rpl10-APEX2 were cultured until they reached the logarithmic phase. Subsequently, they were subjected to nitrogen starvation for 6 h. Following the preparation of the samples, the occurrence of ribophagy was observed through TEM. V: Vacuole. Scale bar: 500 nm
-
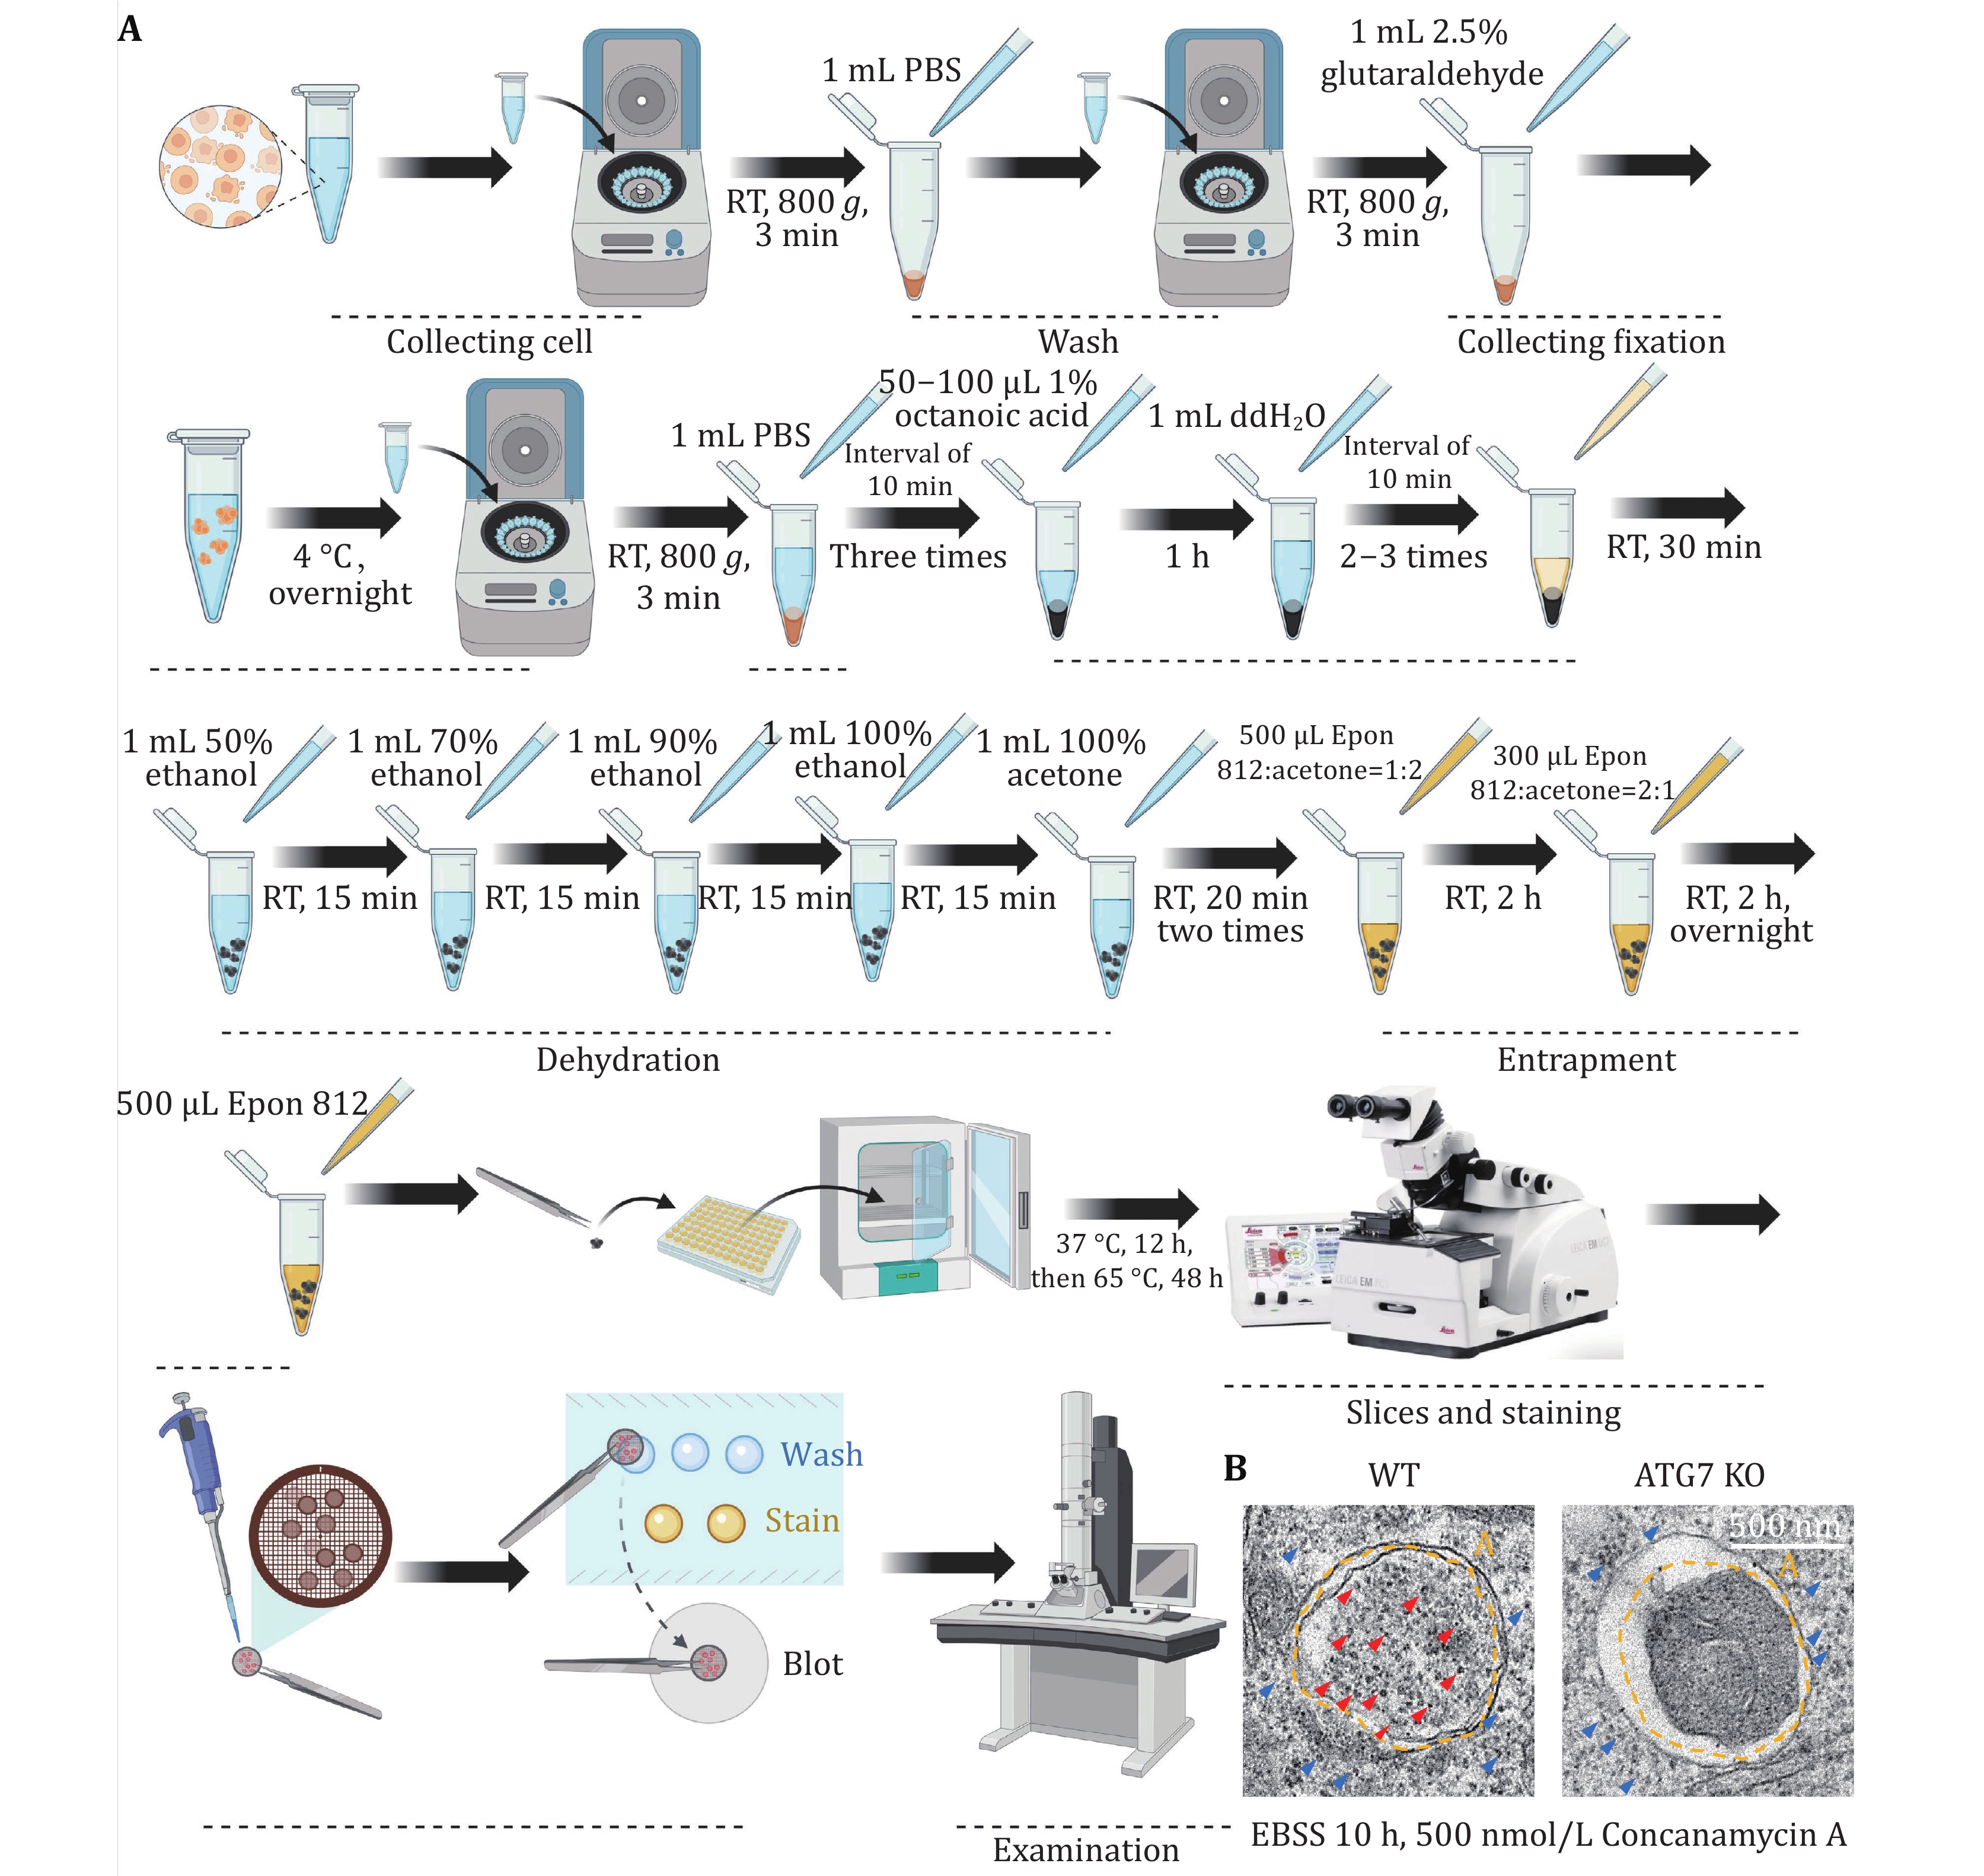
Figure 7. Detecting mammalian ribophagy using TEM. A The flowchart illustrating the detection of mammalian ribophagy using TEM. B When the U2OS WT or ATG7 KO cells on the 6-cm dish reached a density of 90%, they were treated with EBSS and concanamycin A for 10 h, and the samples were collected. Following sample preparation, the occurrence of ribophagy was observed through TEM. The black dot in the picture represents a ribosome. Red arrowheads indicate ribosomes within an autolysosome. Blue arrowheads indicate ribosomes in the cytoplasm. A: Autolysosome. Scale bar: 500 nm
Figure
7 ,Table
1 个