-
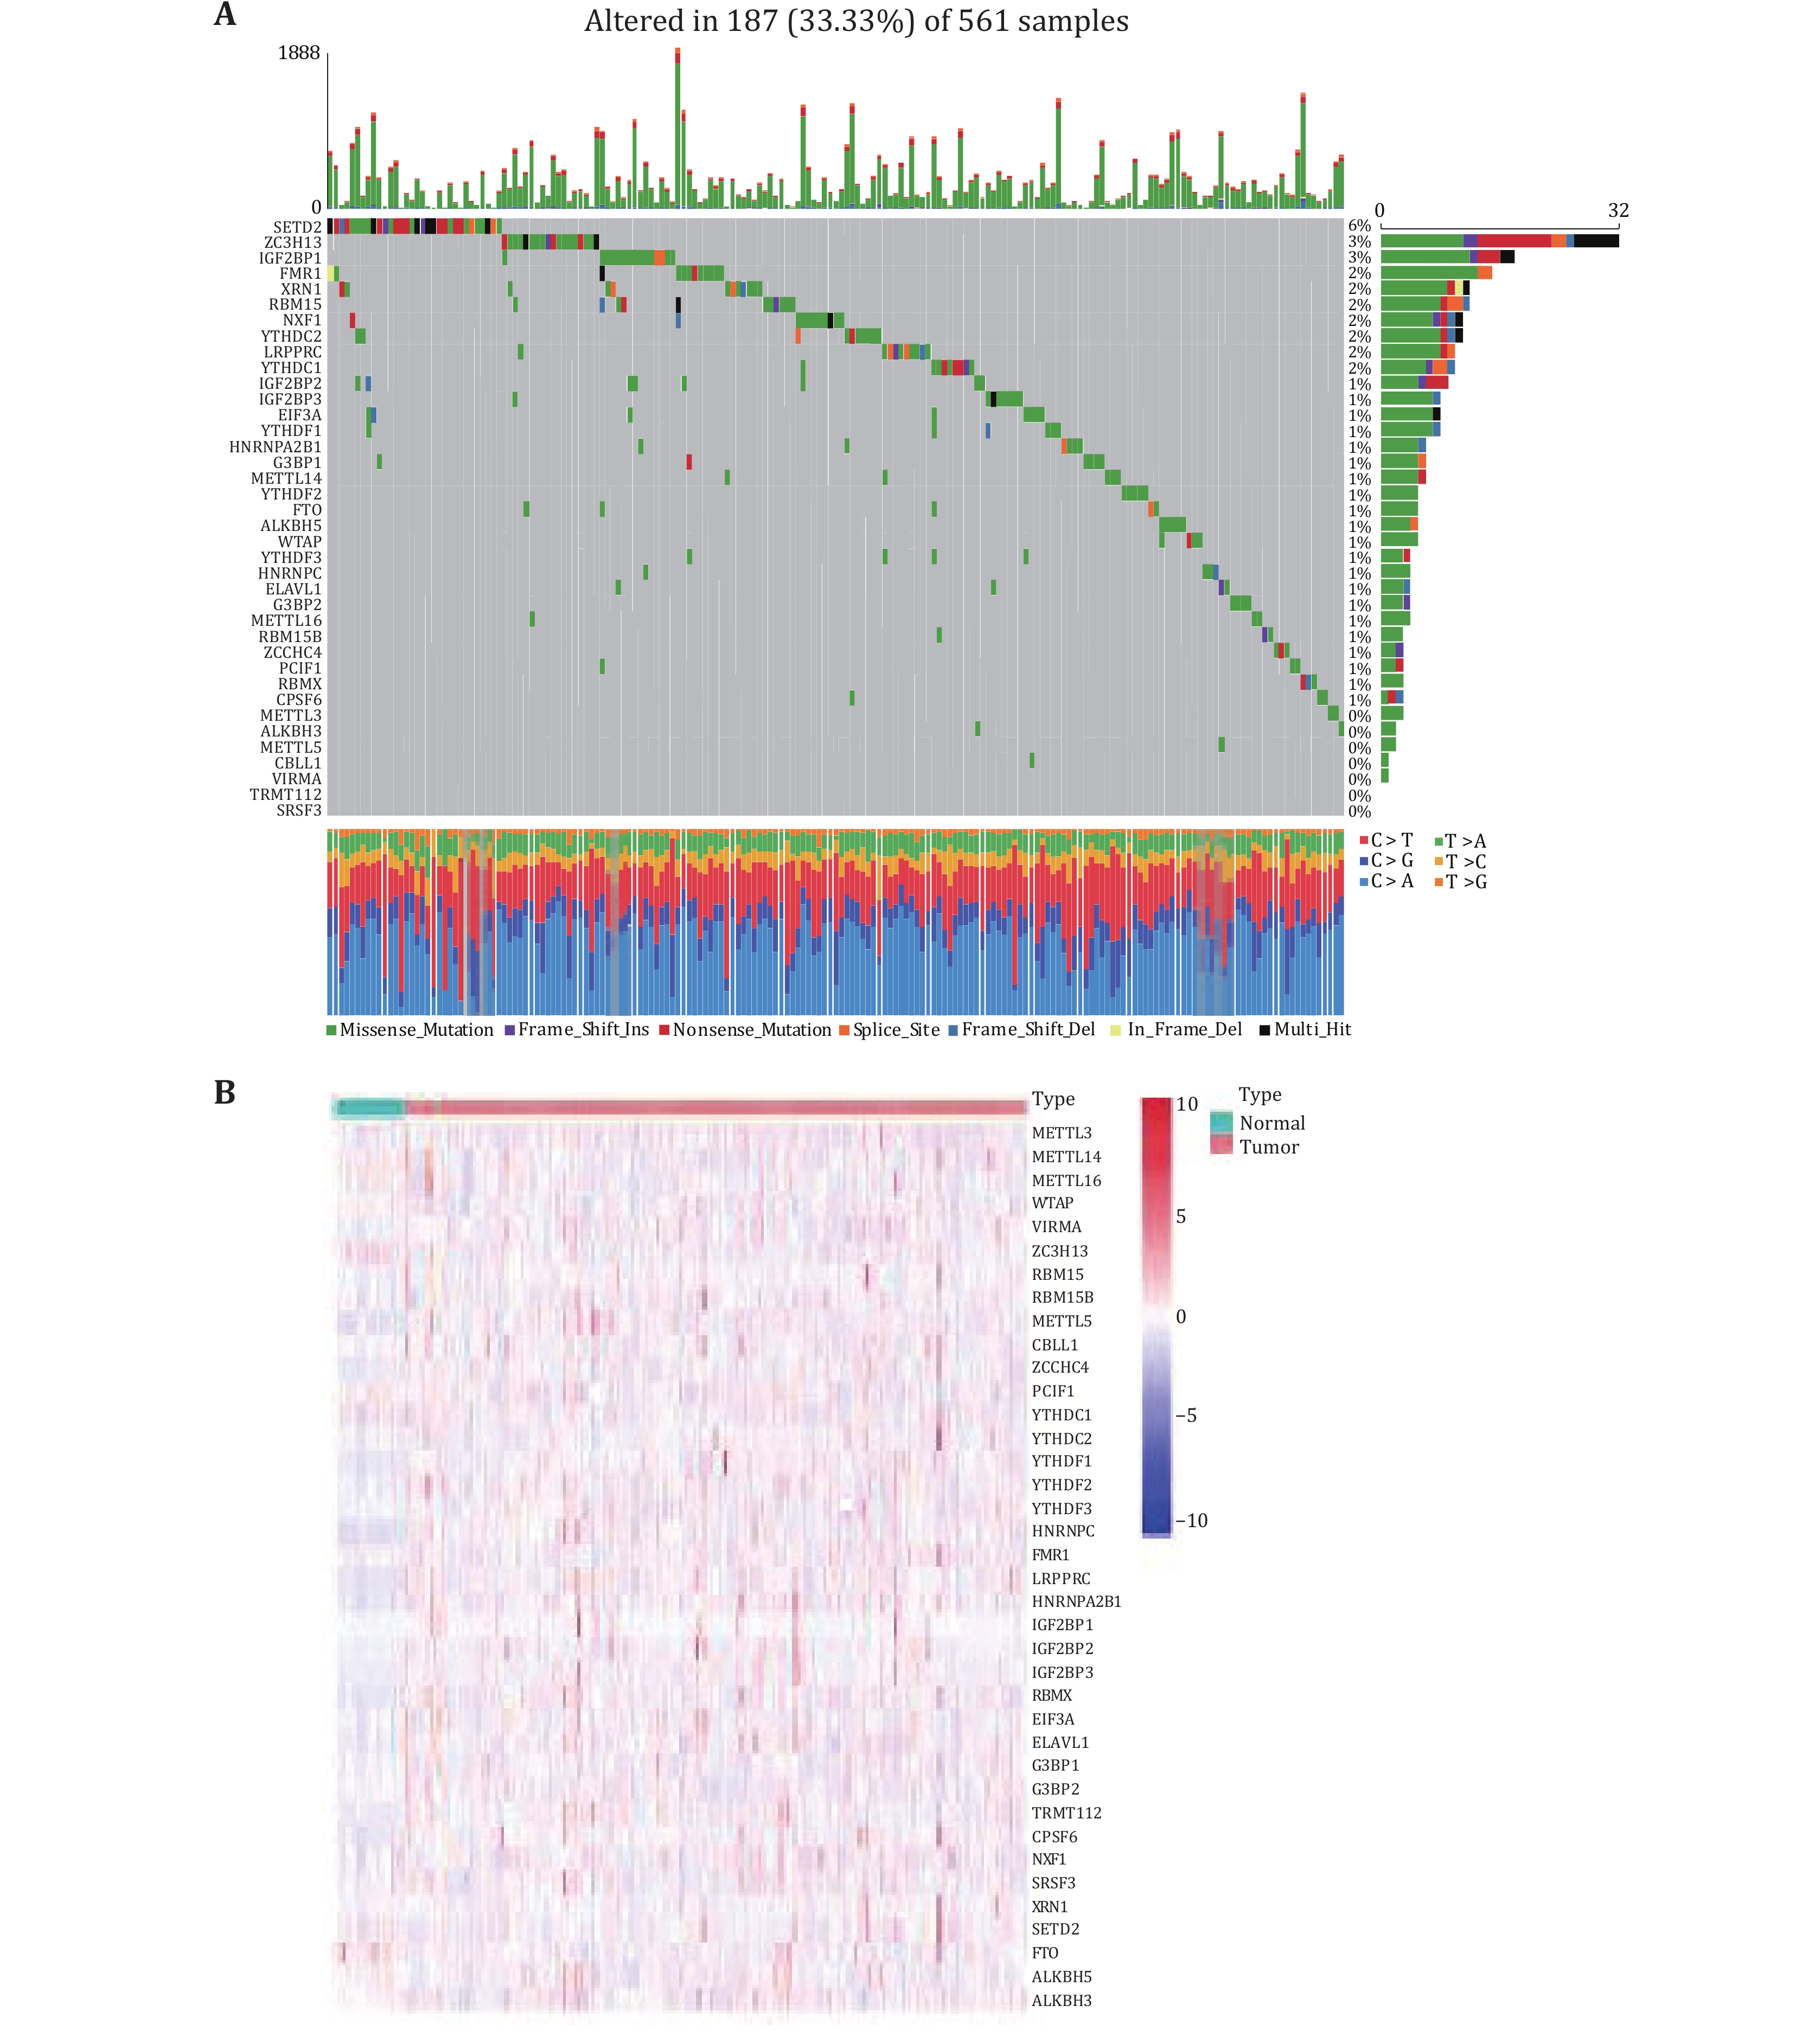
Figure 1. Expression levels of m6A RNA methylation regulators and mutation frequency. A Mutation frequency levels of 38 m6A regulators in LUAD. B The heat map shows the expression levels of 38 m6A regulators in LUAD and normal samples
-
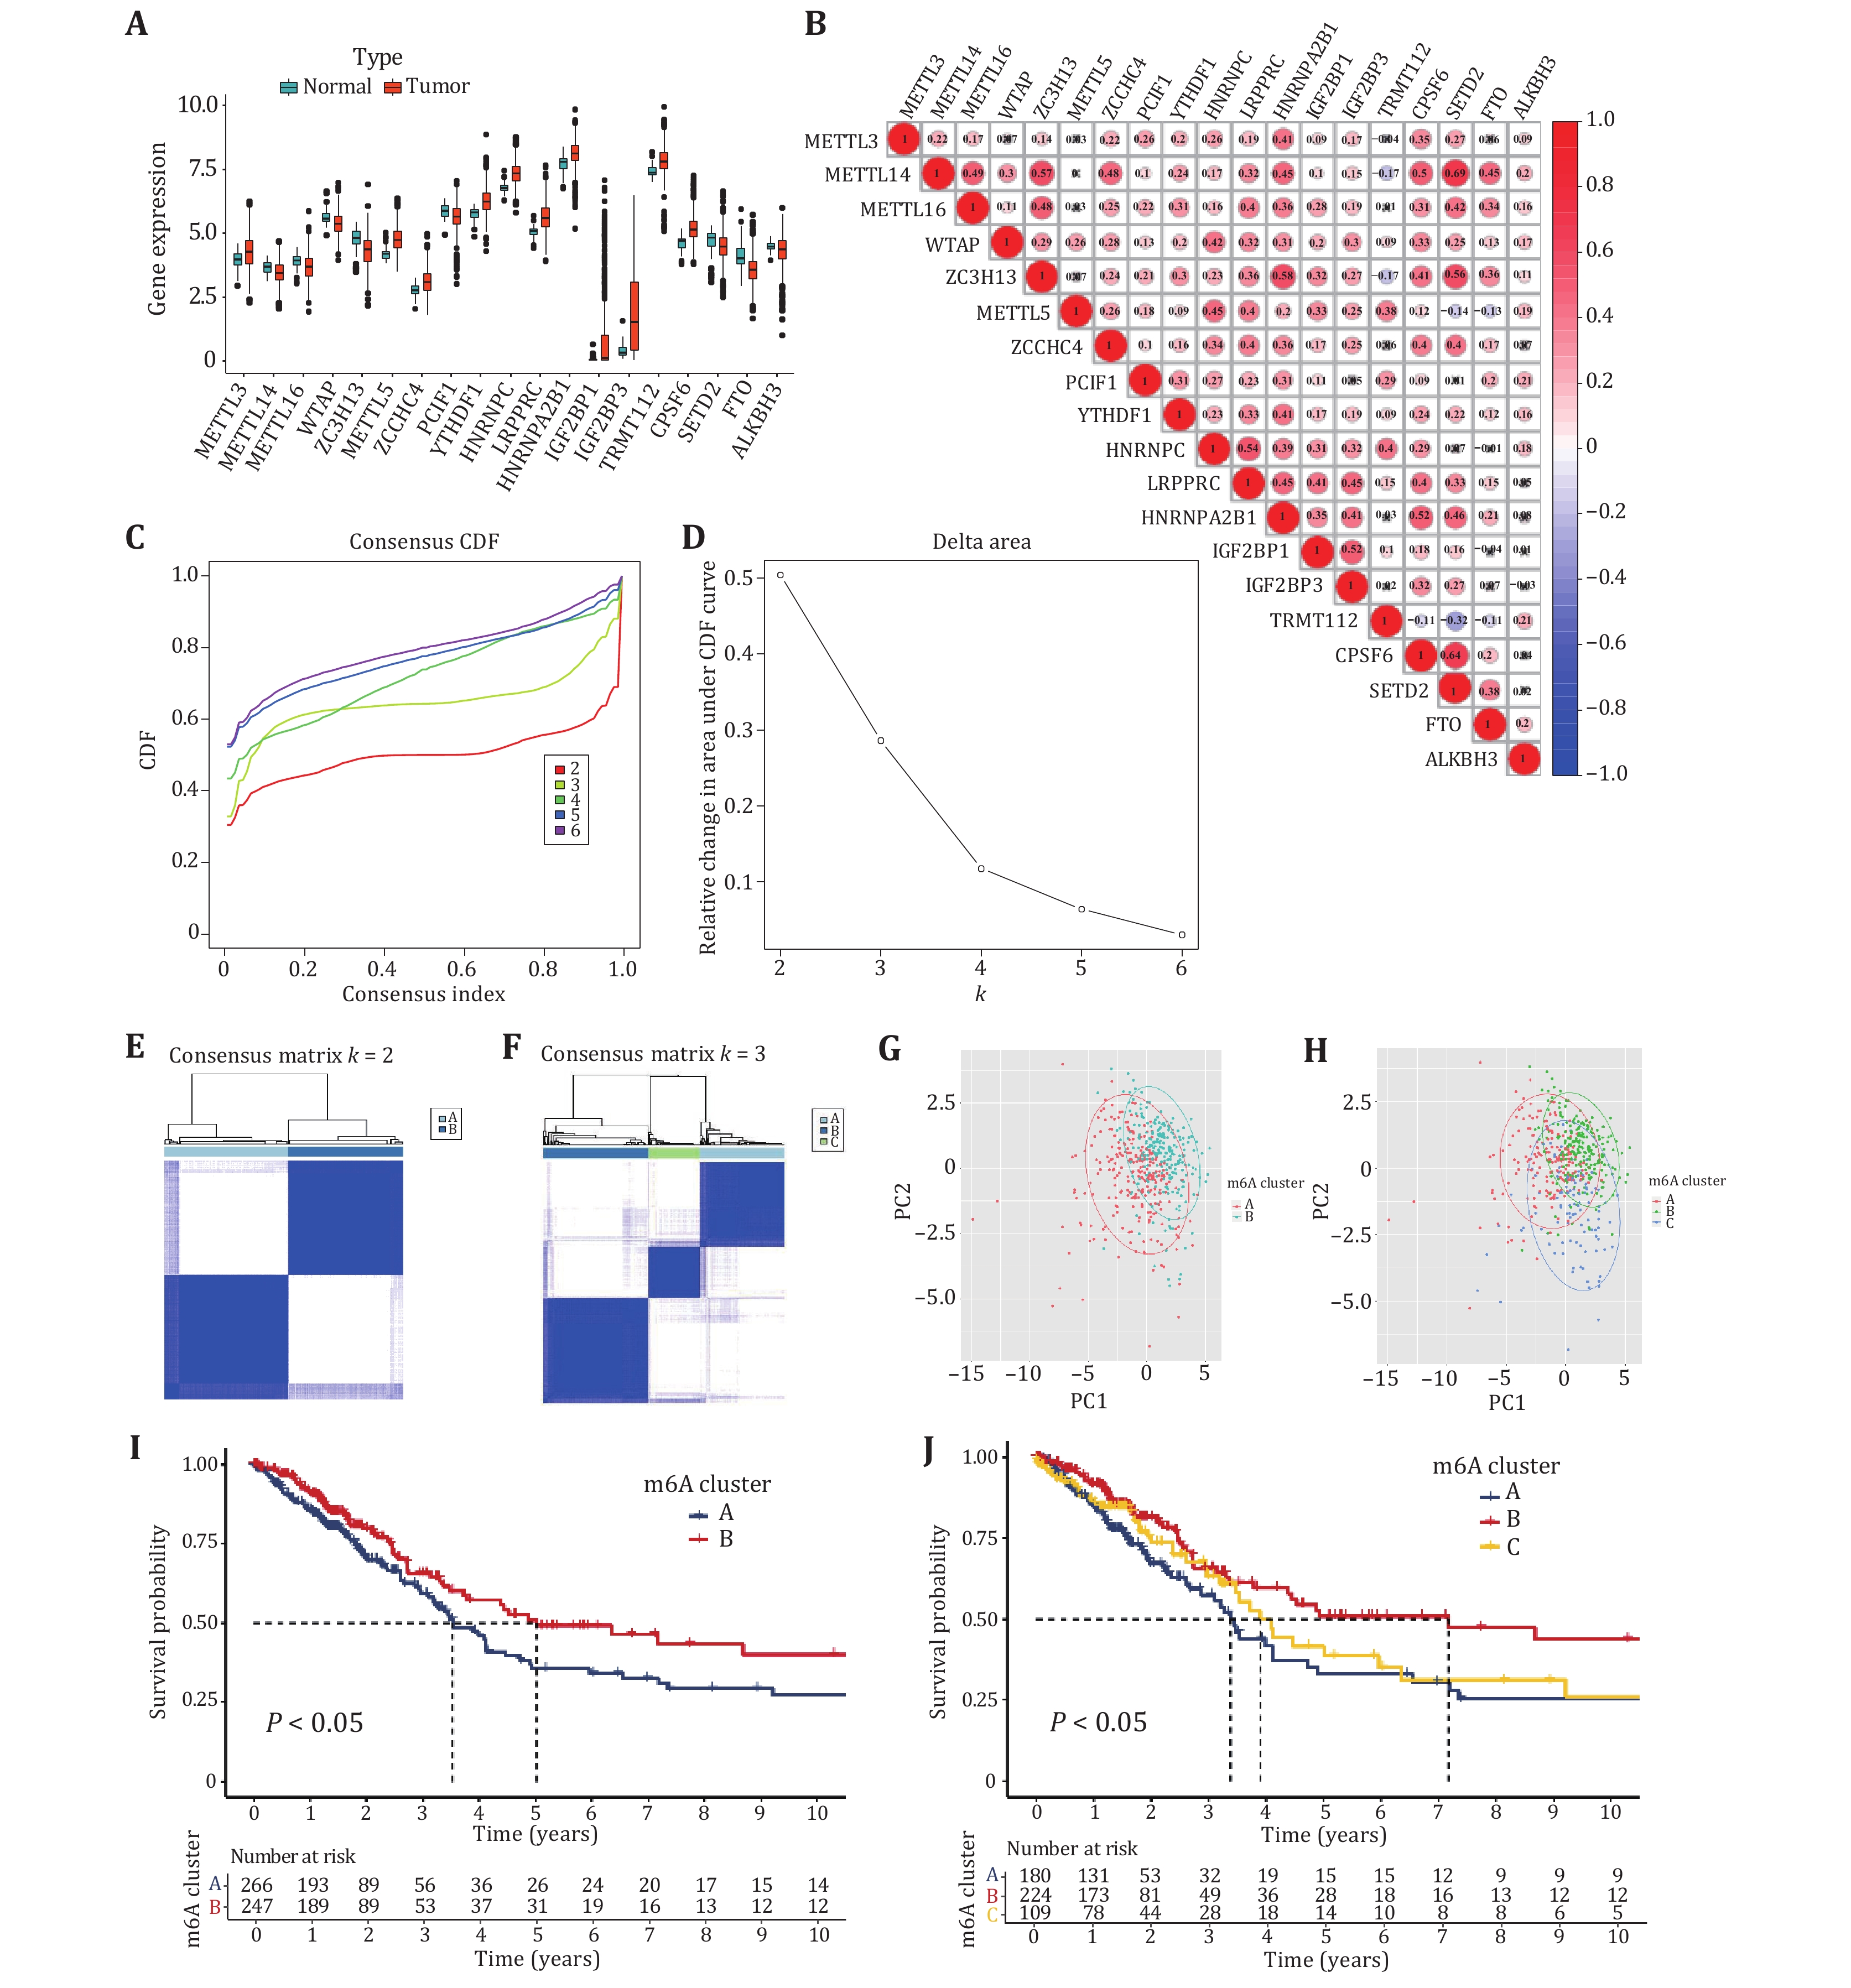
Figure 2. Different analysis of m6A RNA methylation regulators and consensus clustering analysis. A Expression distributions of m6A regulators in tumor and normal samples. B Co-expression patterns of 19 differentially expressed m6A regulators. Negative correlations are marked with blue, and positive correlations are marked with red. C Consensus clustering CDF for k = 2, 3, 4, 5 and 6. D CDF curve for consensus clustering. E Consensus clustering of LUAD patients for k = 2. F Consensus clustering CDF for k = 3. G Principal component analysis for patients in Clusters A and B. H Principal component analysis for patients in Clusters A, B and C. I Survival analyses for patients in Clusters A and B. J Survival analyses for patients in Clusters A, B and C
-
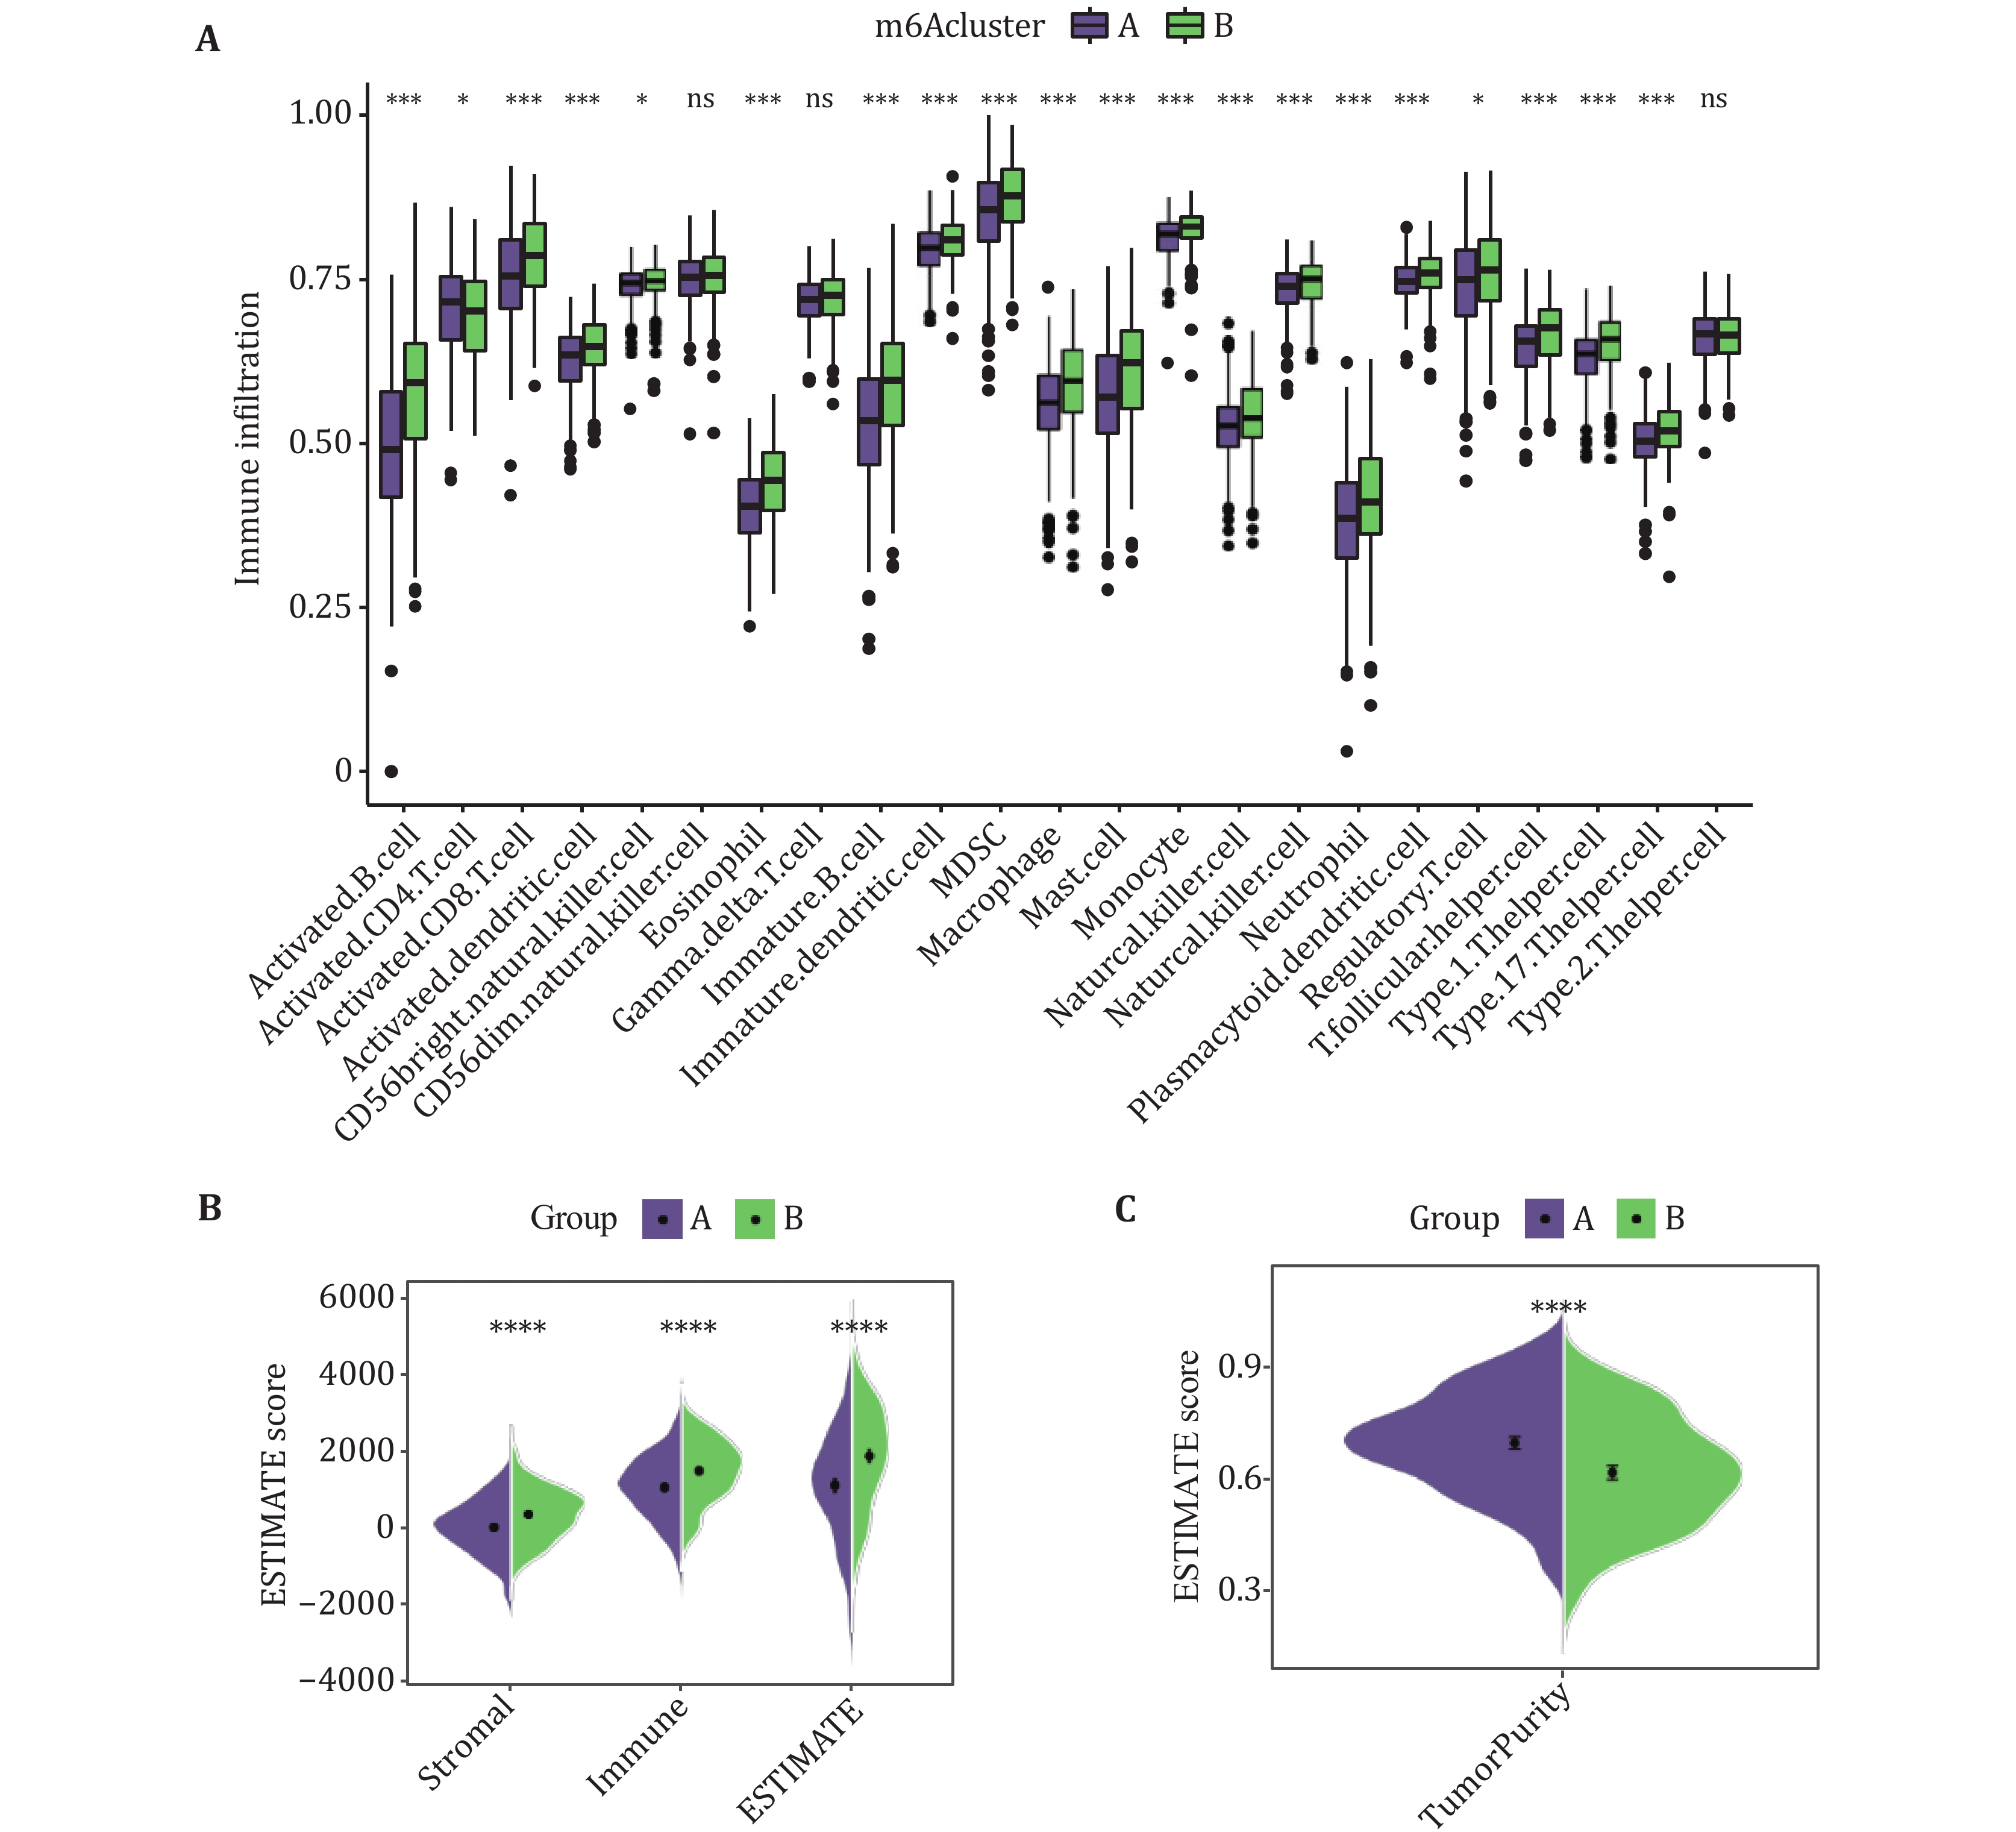
Figure 3. Tumor immune microenvironment between Subtype A and Subtype B patients with LUAD. A Infiltration of 23 immune cells in Subtypes A and B. B The estimated score of immune cells and stromal cells between Subtype A and Subtype B. C The estimated score of tumor purity between Subtype A and Subtype B
-
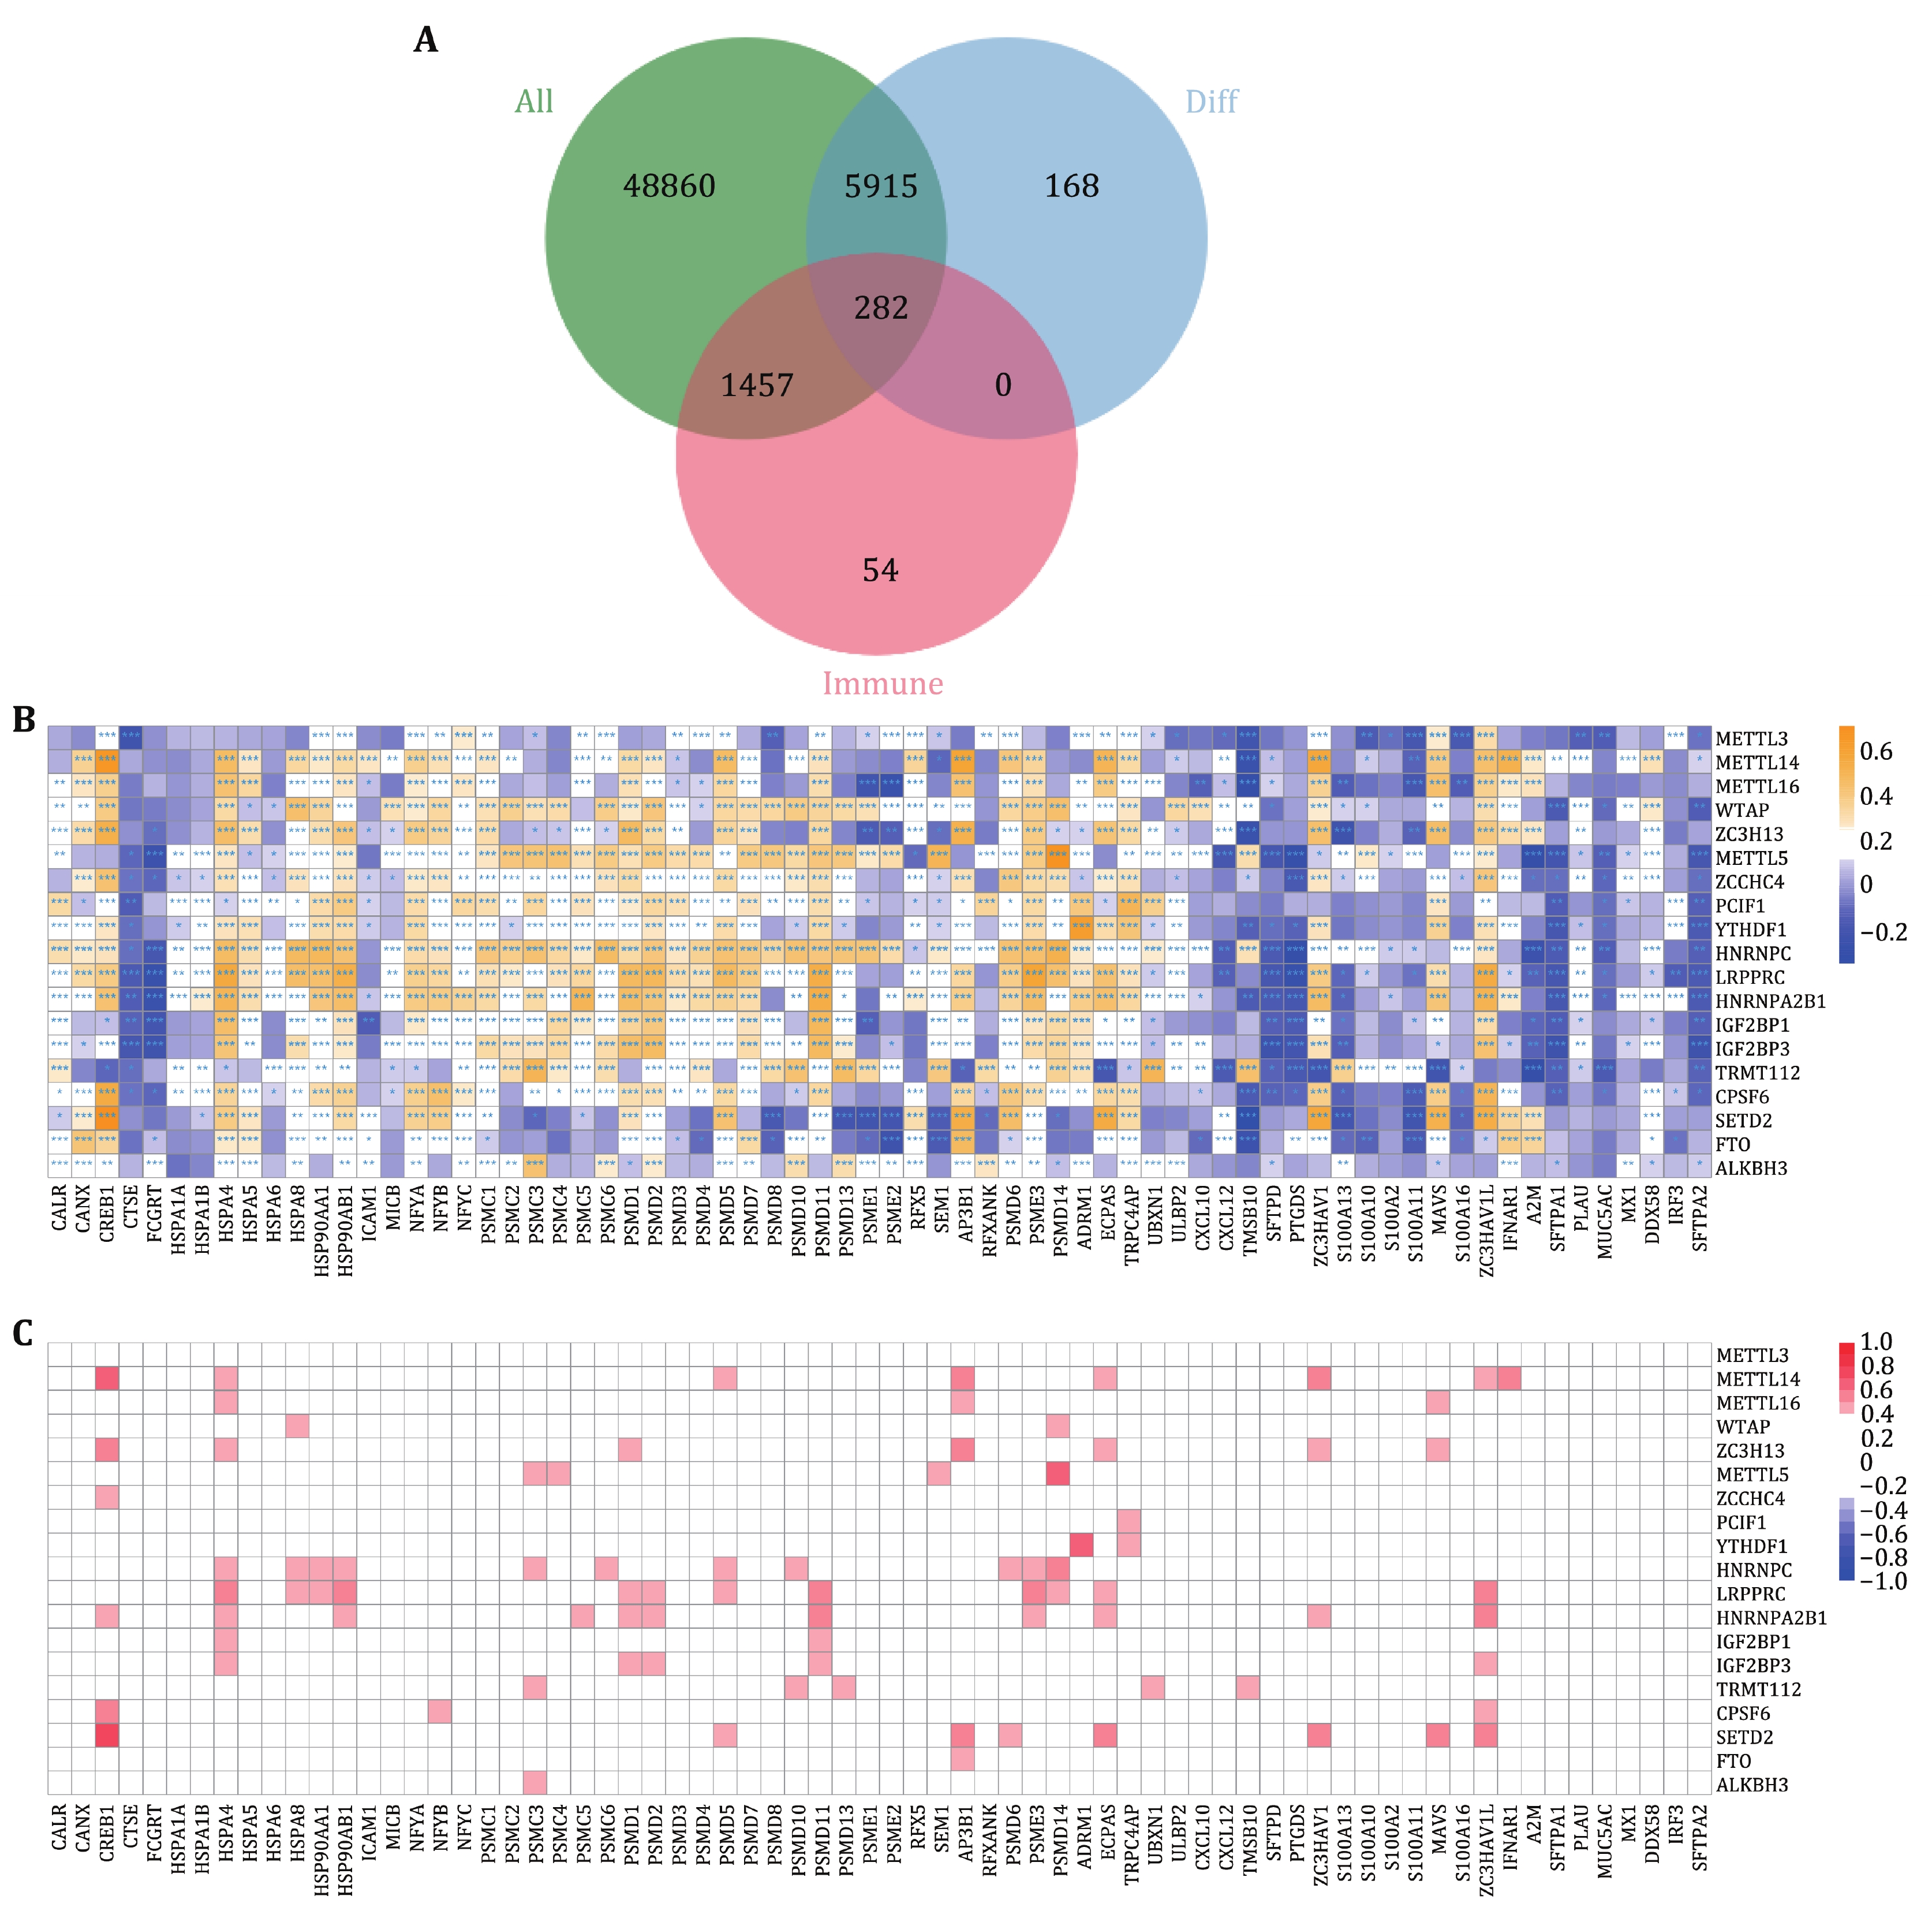
Figure 4. Association analysis of immune genes and m6A regulators. A Selection of differentially expressed immune genes. B Pearson correlation between 19 differentially expressed m6A regulators and 282 immune genes. C Visualization of genes whose coefficients were greater than 0.1 and P.adj < 0.05, which were called m6A-related immune genes
-
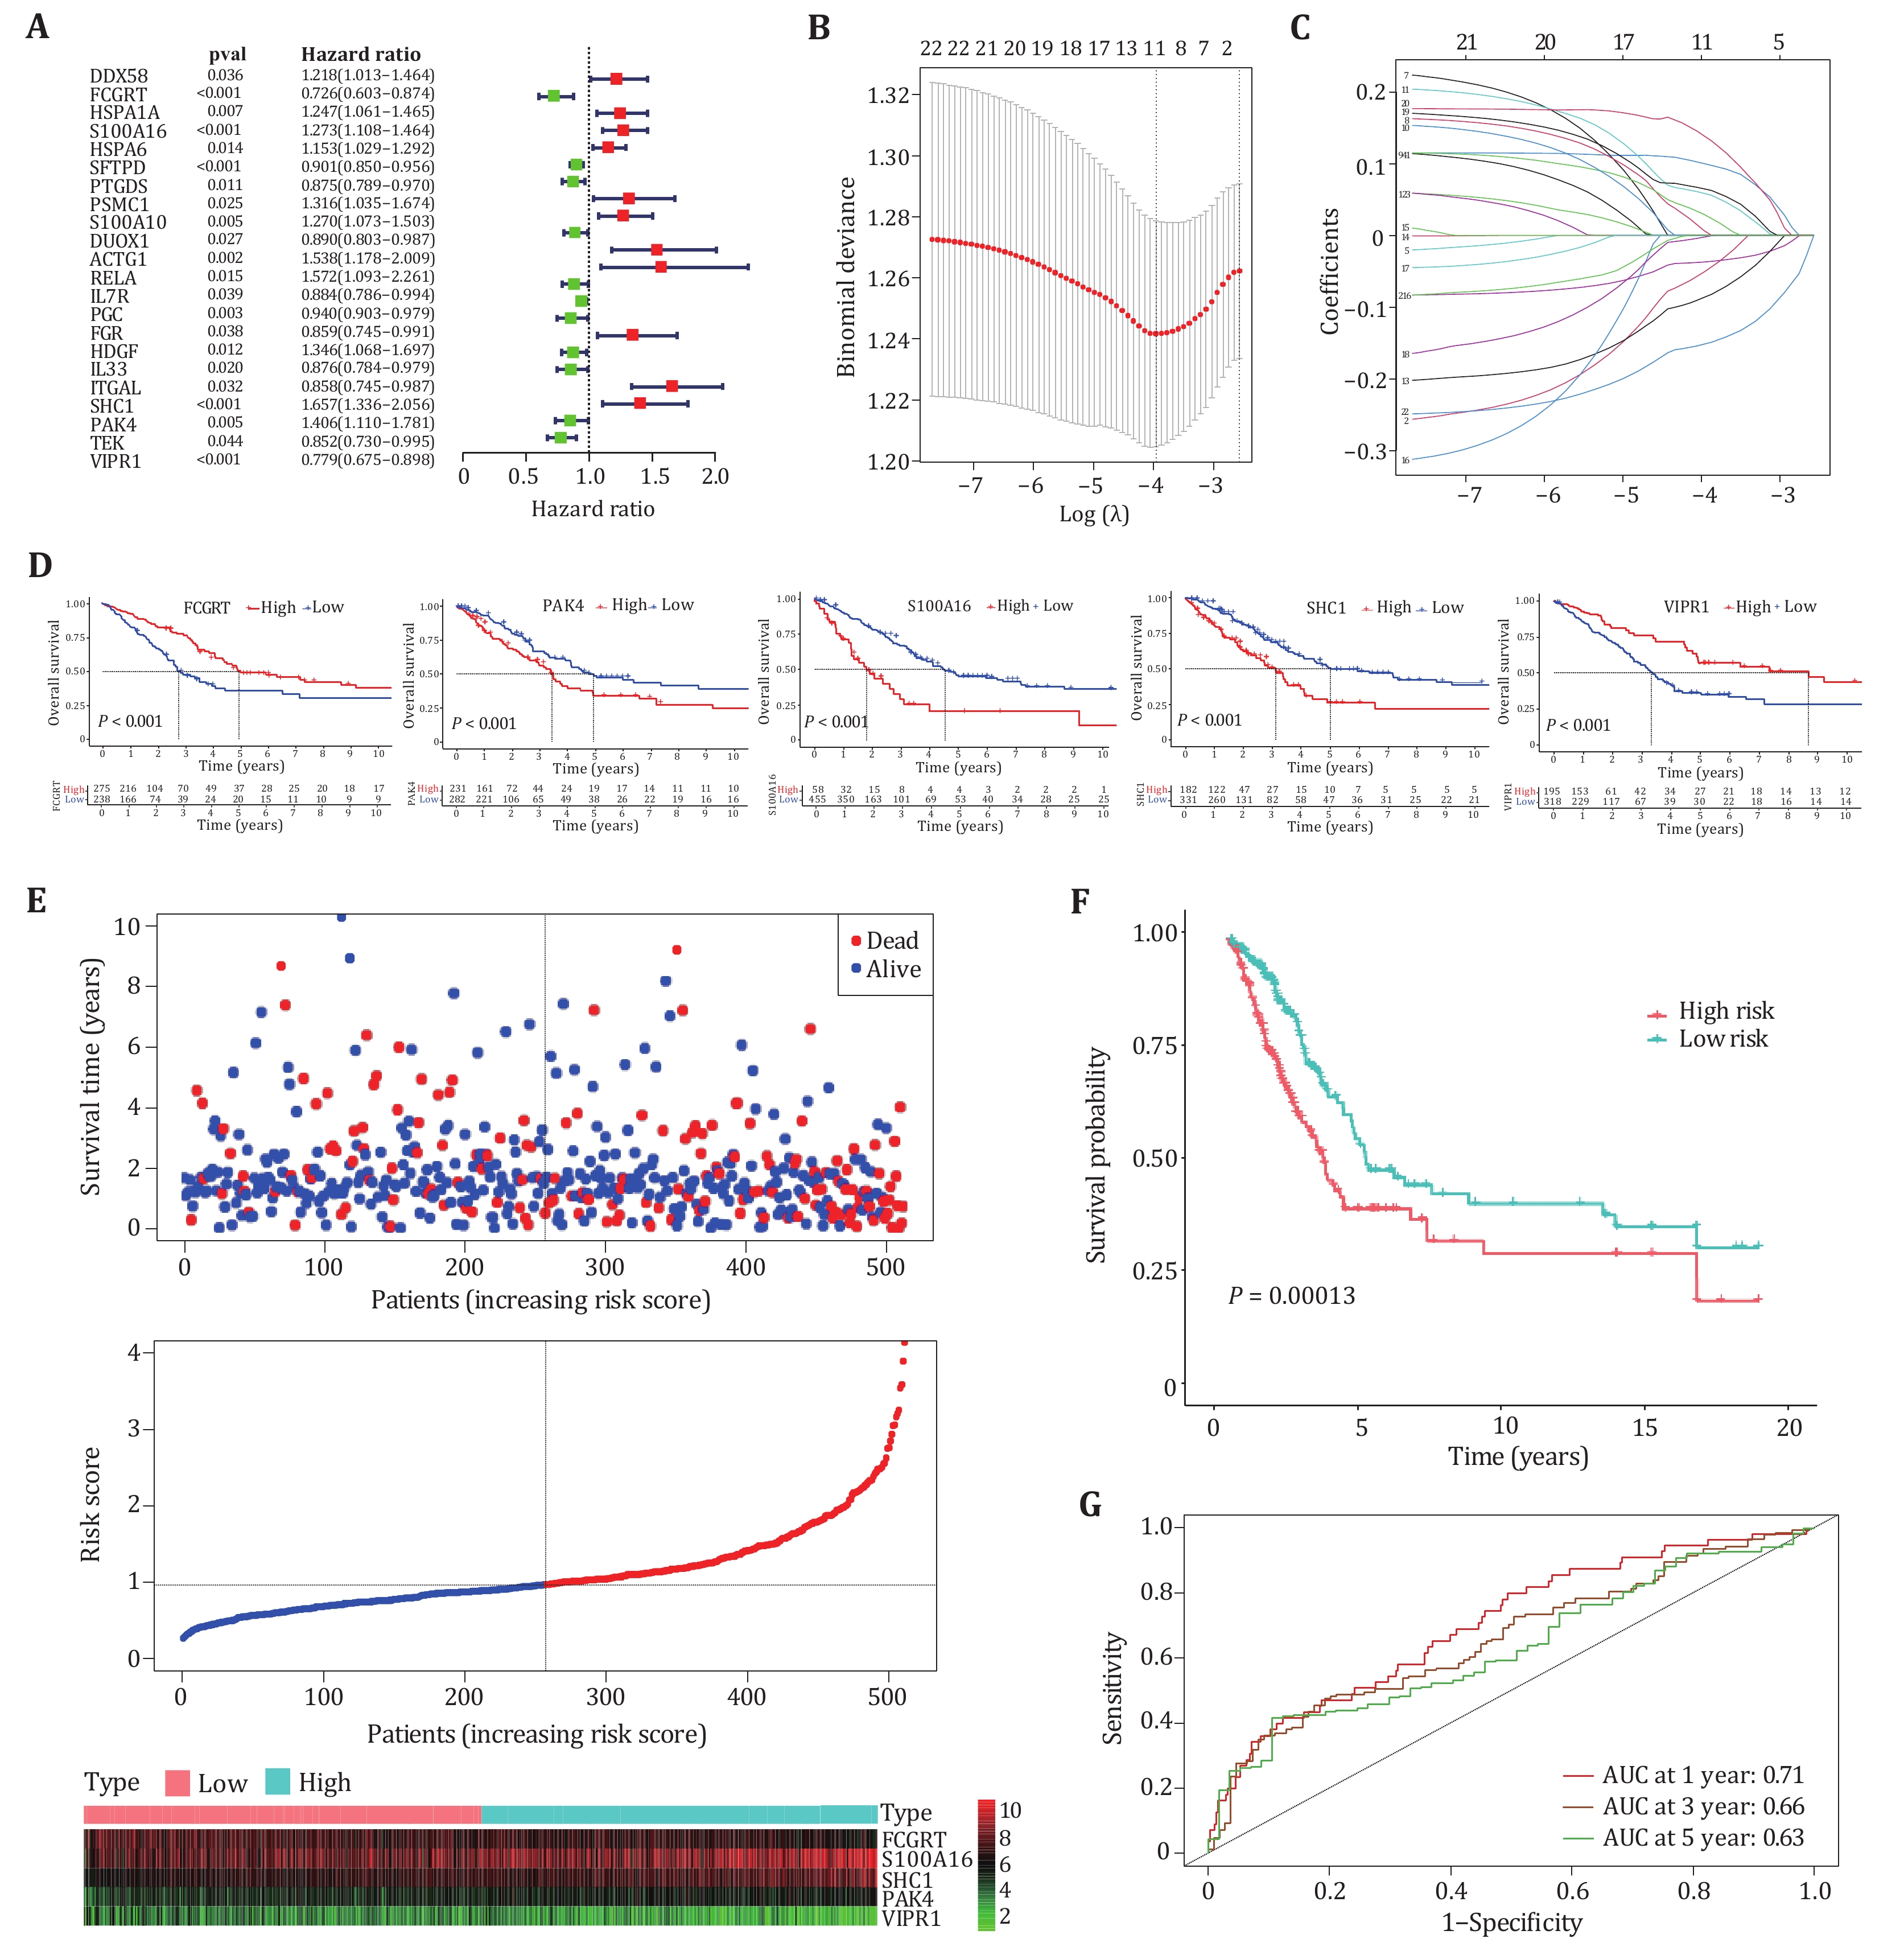
Figure 5. Construction of prognostic models based on m6A-related immune genes. A Univariate Cox regression analysis of 22 immune genes associated with m6A. B,C Least Absolute Shrinkage and Selection Operator (LASSO) algorithm narrows the range of immune prognostic genes. D The performance of five immune prognostic genes in patient prognosis. Wherein "high" represents high expression and "low" represents low expression. E Survival status, risk score, and expression distribution of five immune prognostic genes. High-risk and low-risk patients are separated by dashed lines. F Kaplan-Meier analysis of overall survival in the high-risk and low-risk groups. G ROC curves of five-gene prognostic models
-
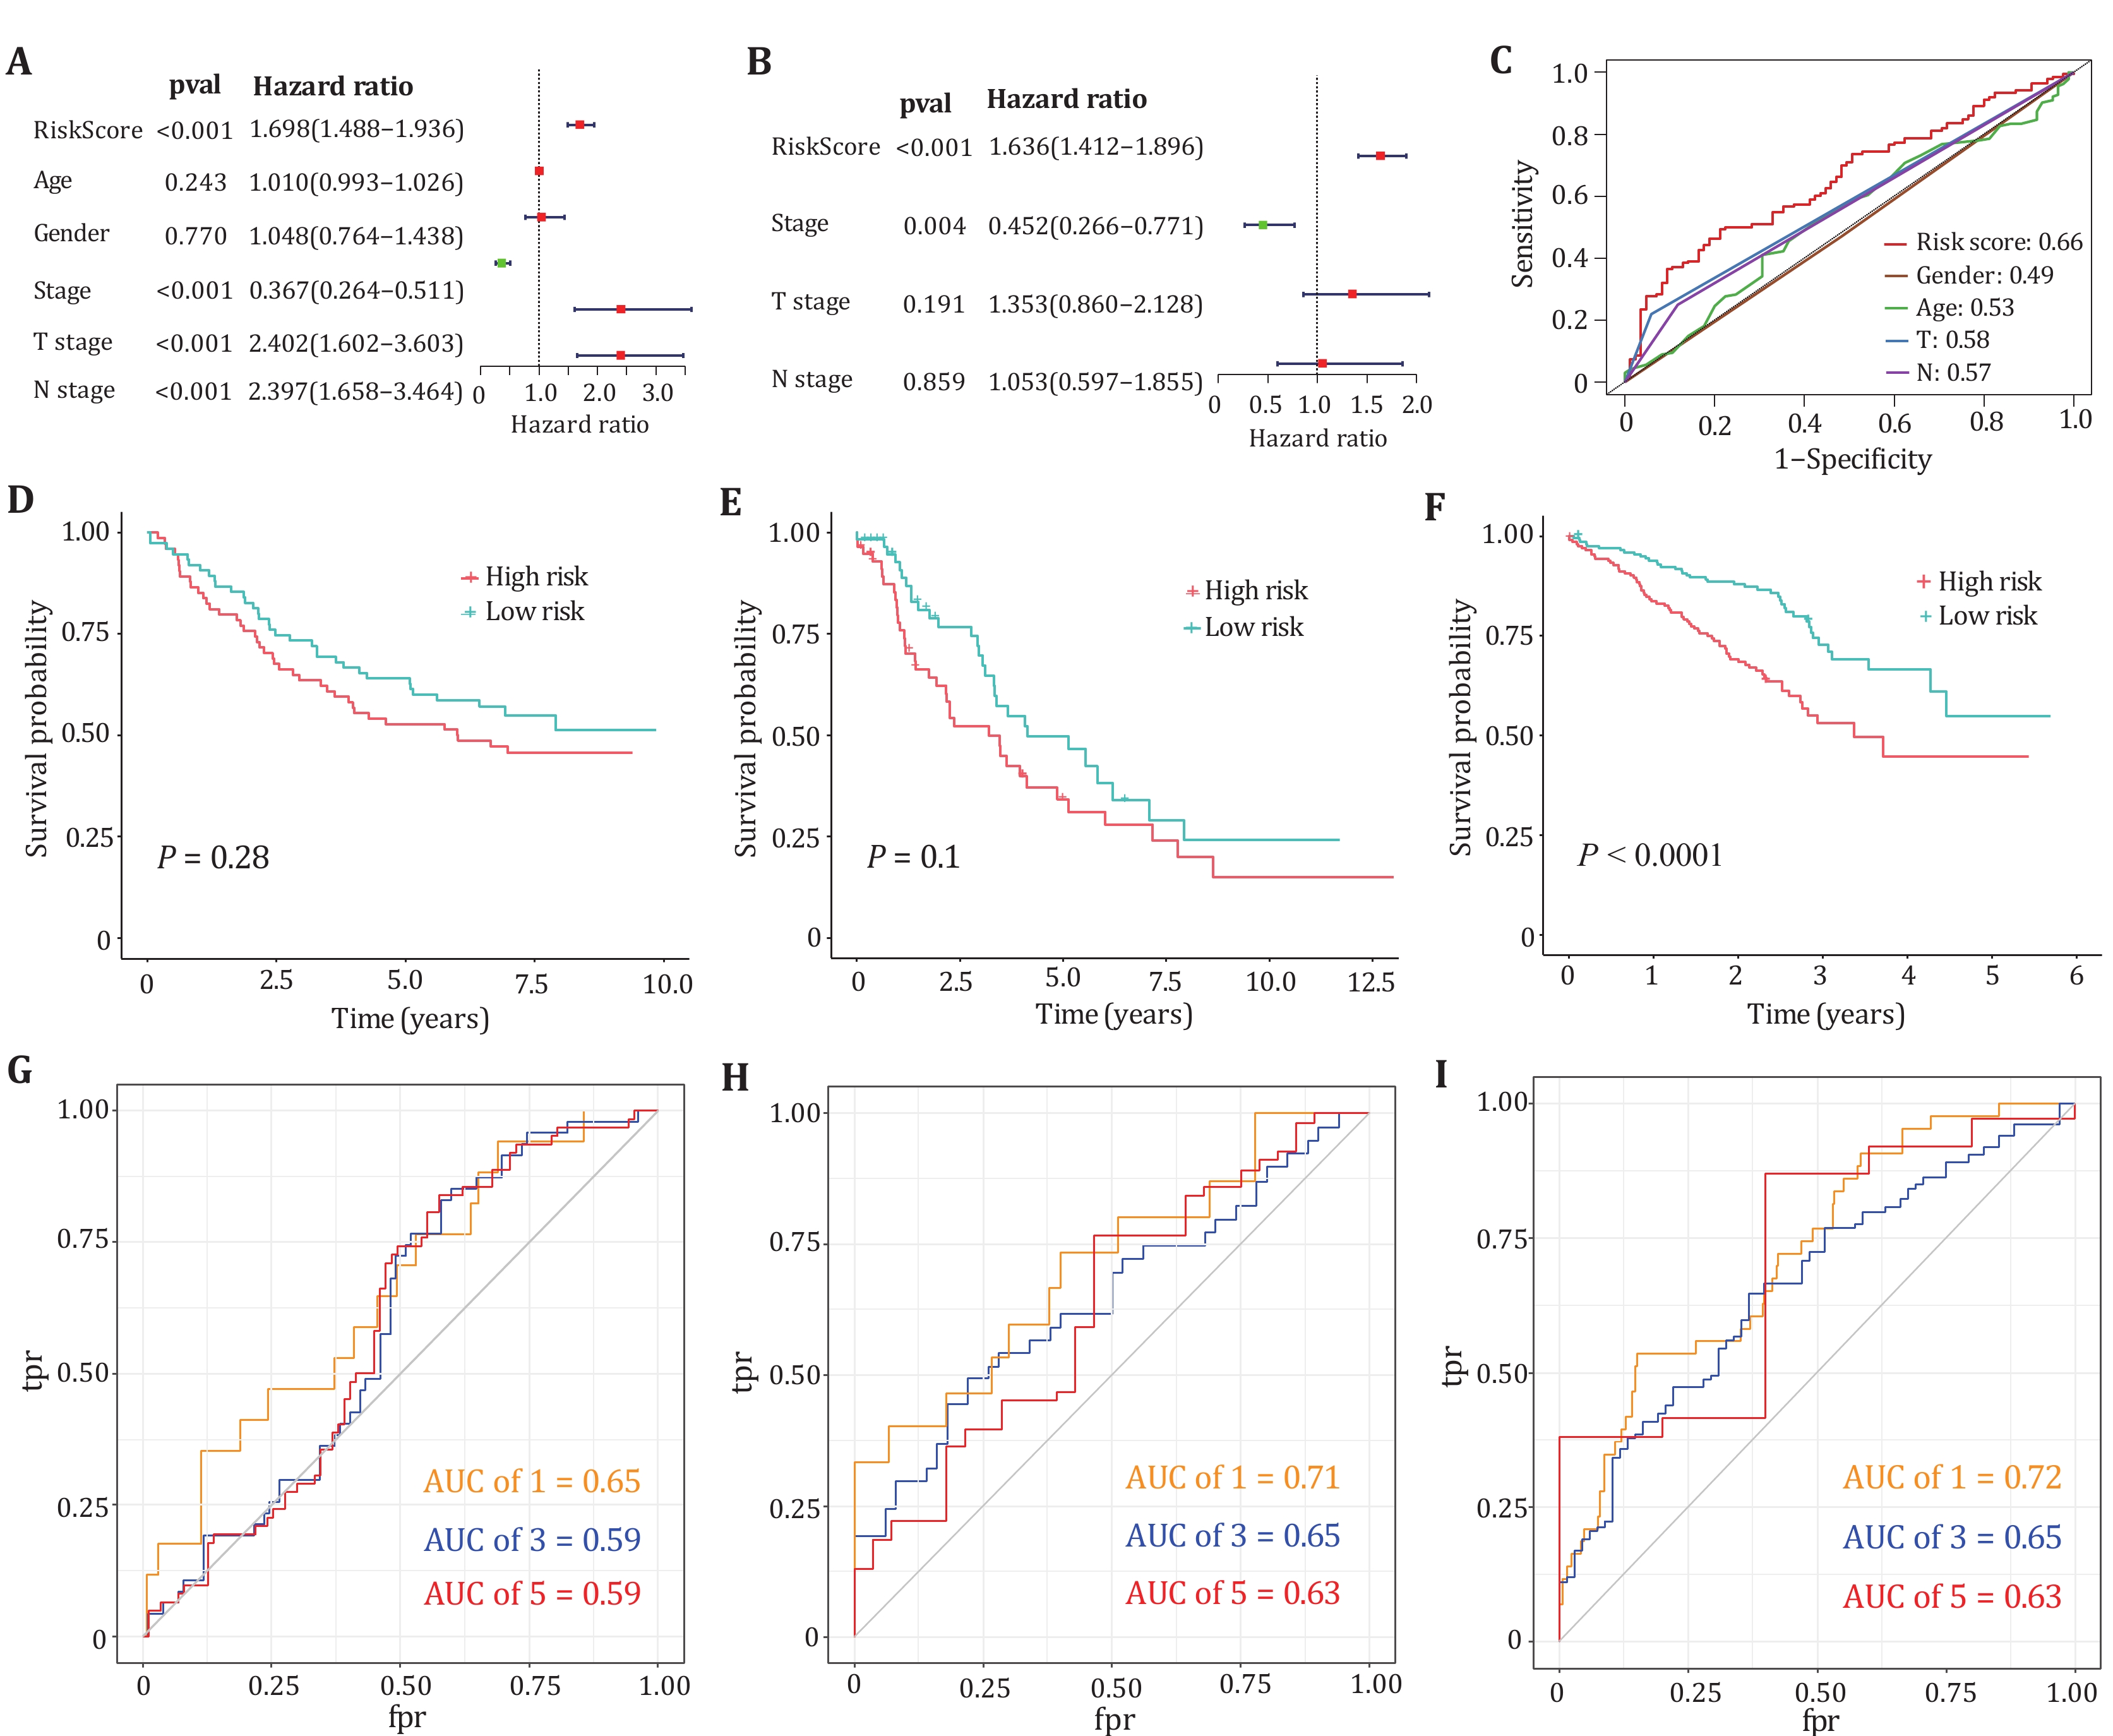
Figure 6. Validation of clinical features and models. A,B Univariate and multivariate Cox analyses of LUAD clinical parameters and prognostic models. C ROC curves for clinical characteristics and prognostic models. D−F Kaplan-Meier survival curves for three datasets GSE11969, GSE26939 and GSE72094. G−I The one-year, three-year and five-year ROC curves for the three data sets
Figure
6 ,Table
0 个