-
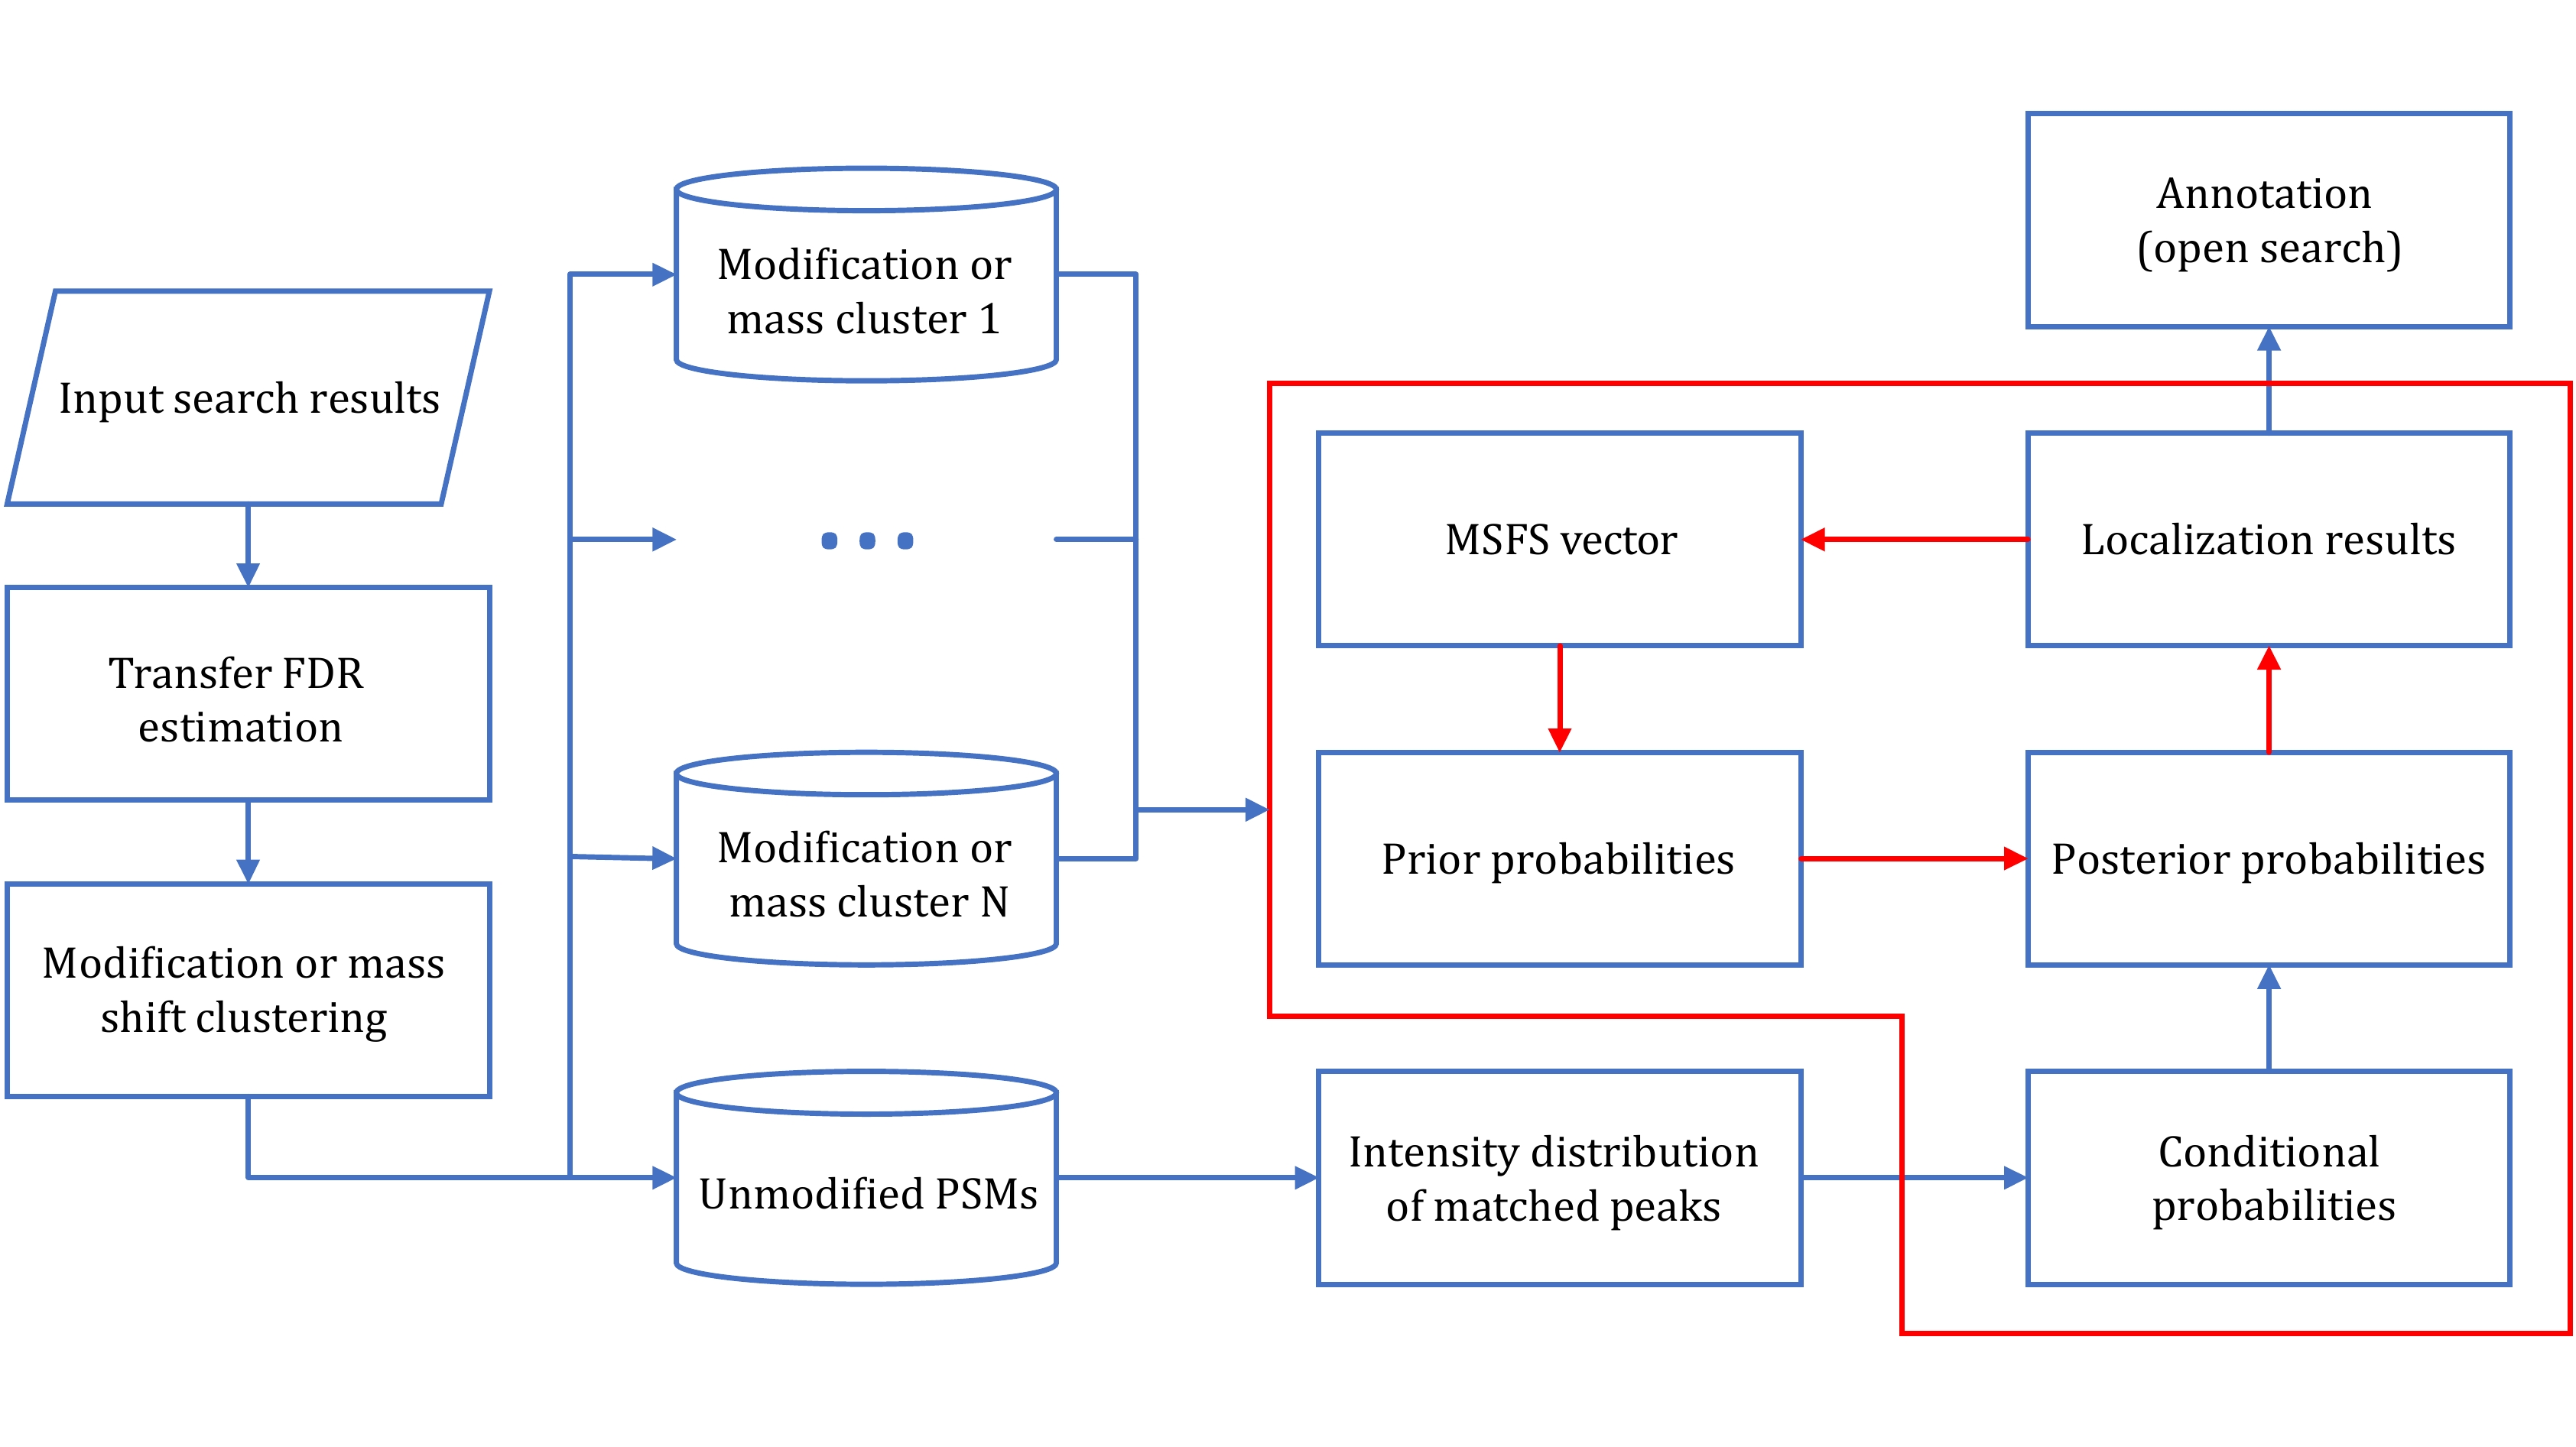
Figure 1. The workflow of PTMiner. The part in the red box shows the process of the localization algorithm, in which the red arrows represent iterative updating of prior probabilities
-
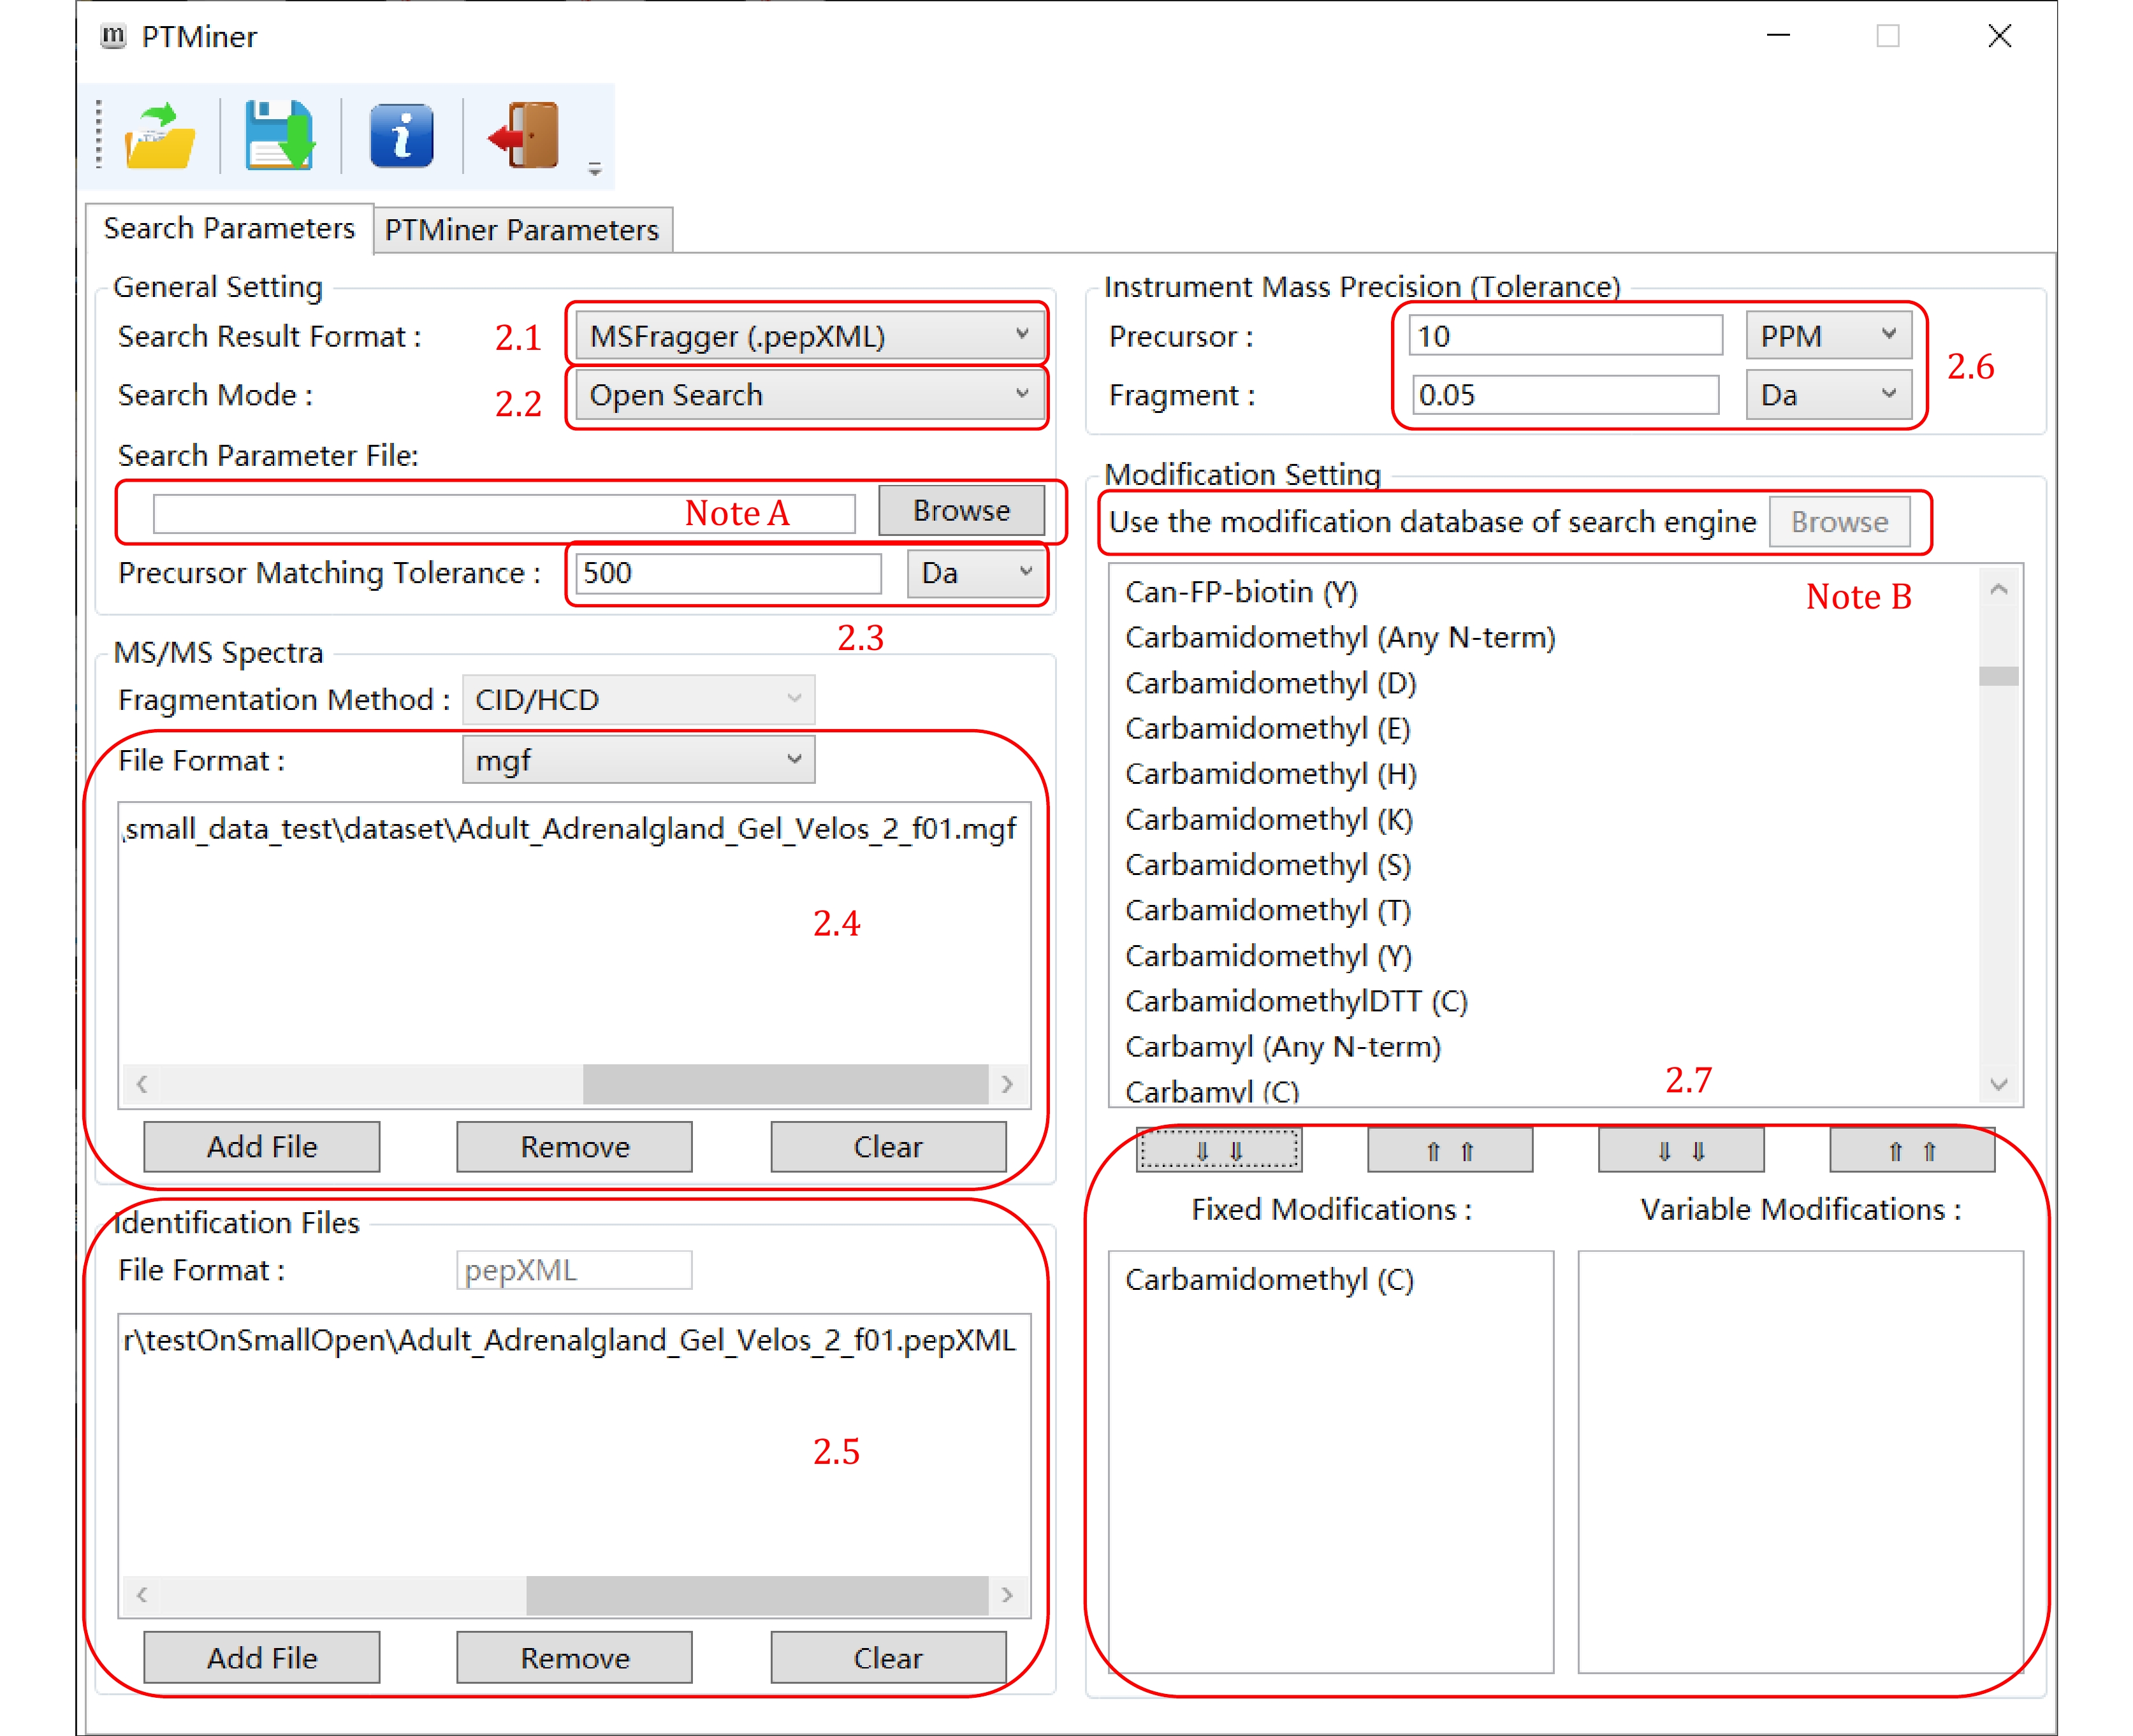
Figure 2. Setting the search parameters (open search)
-
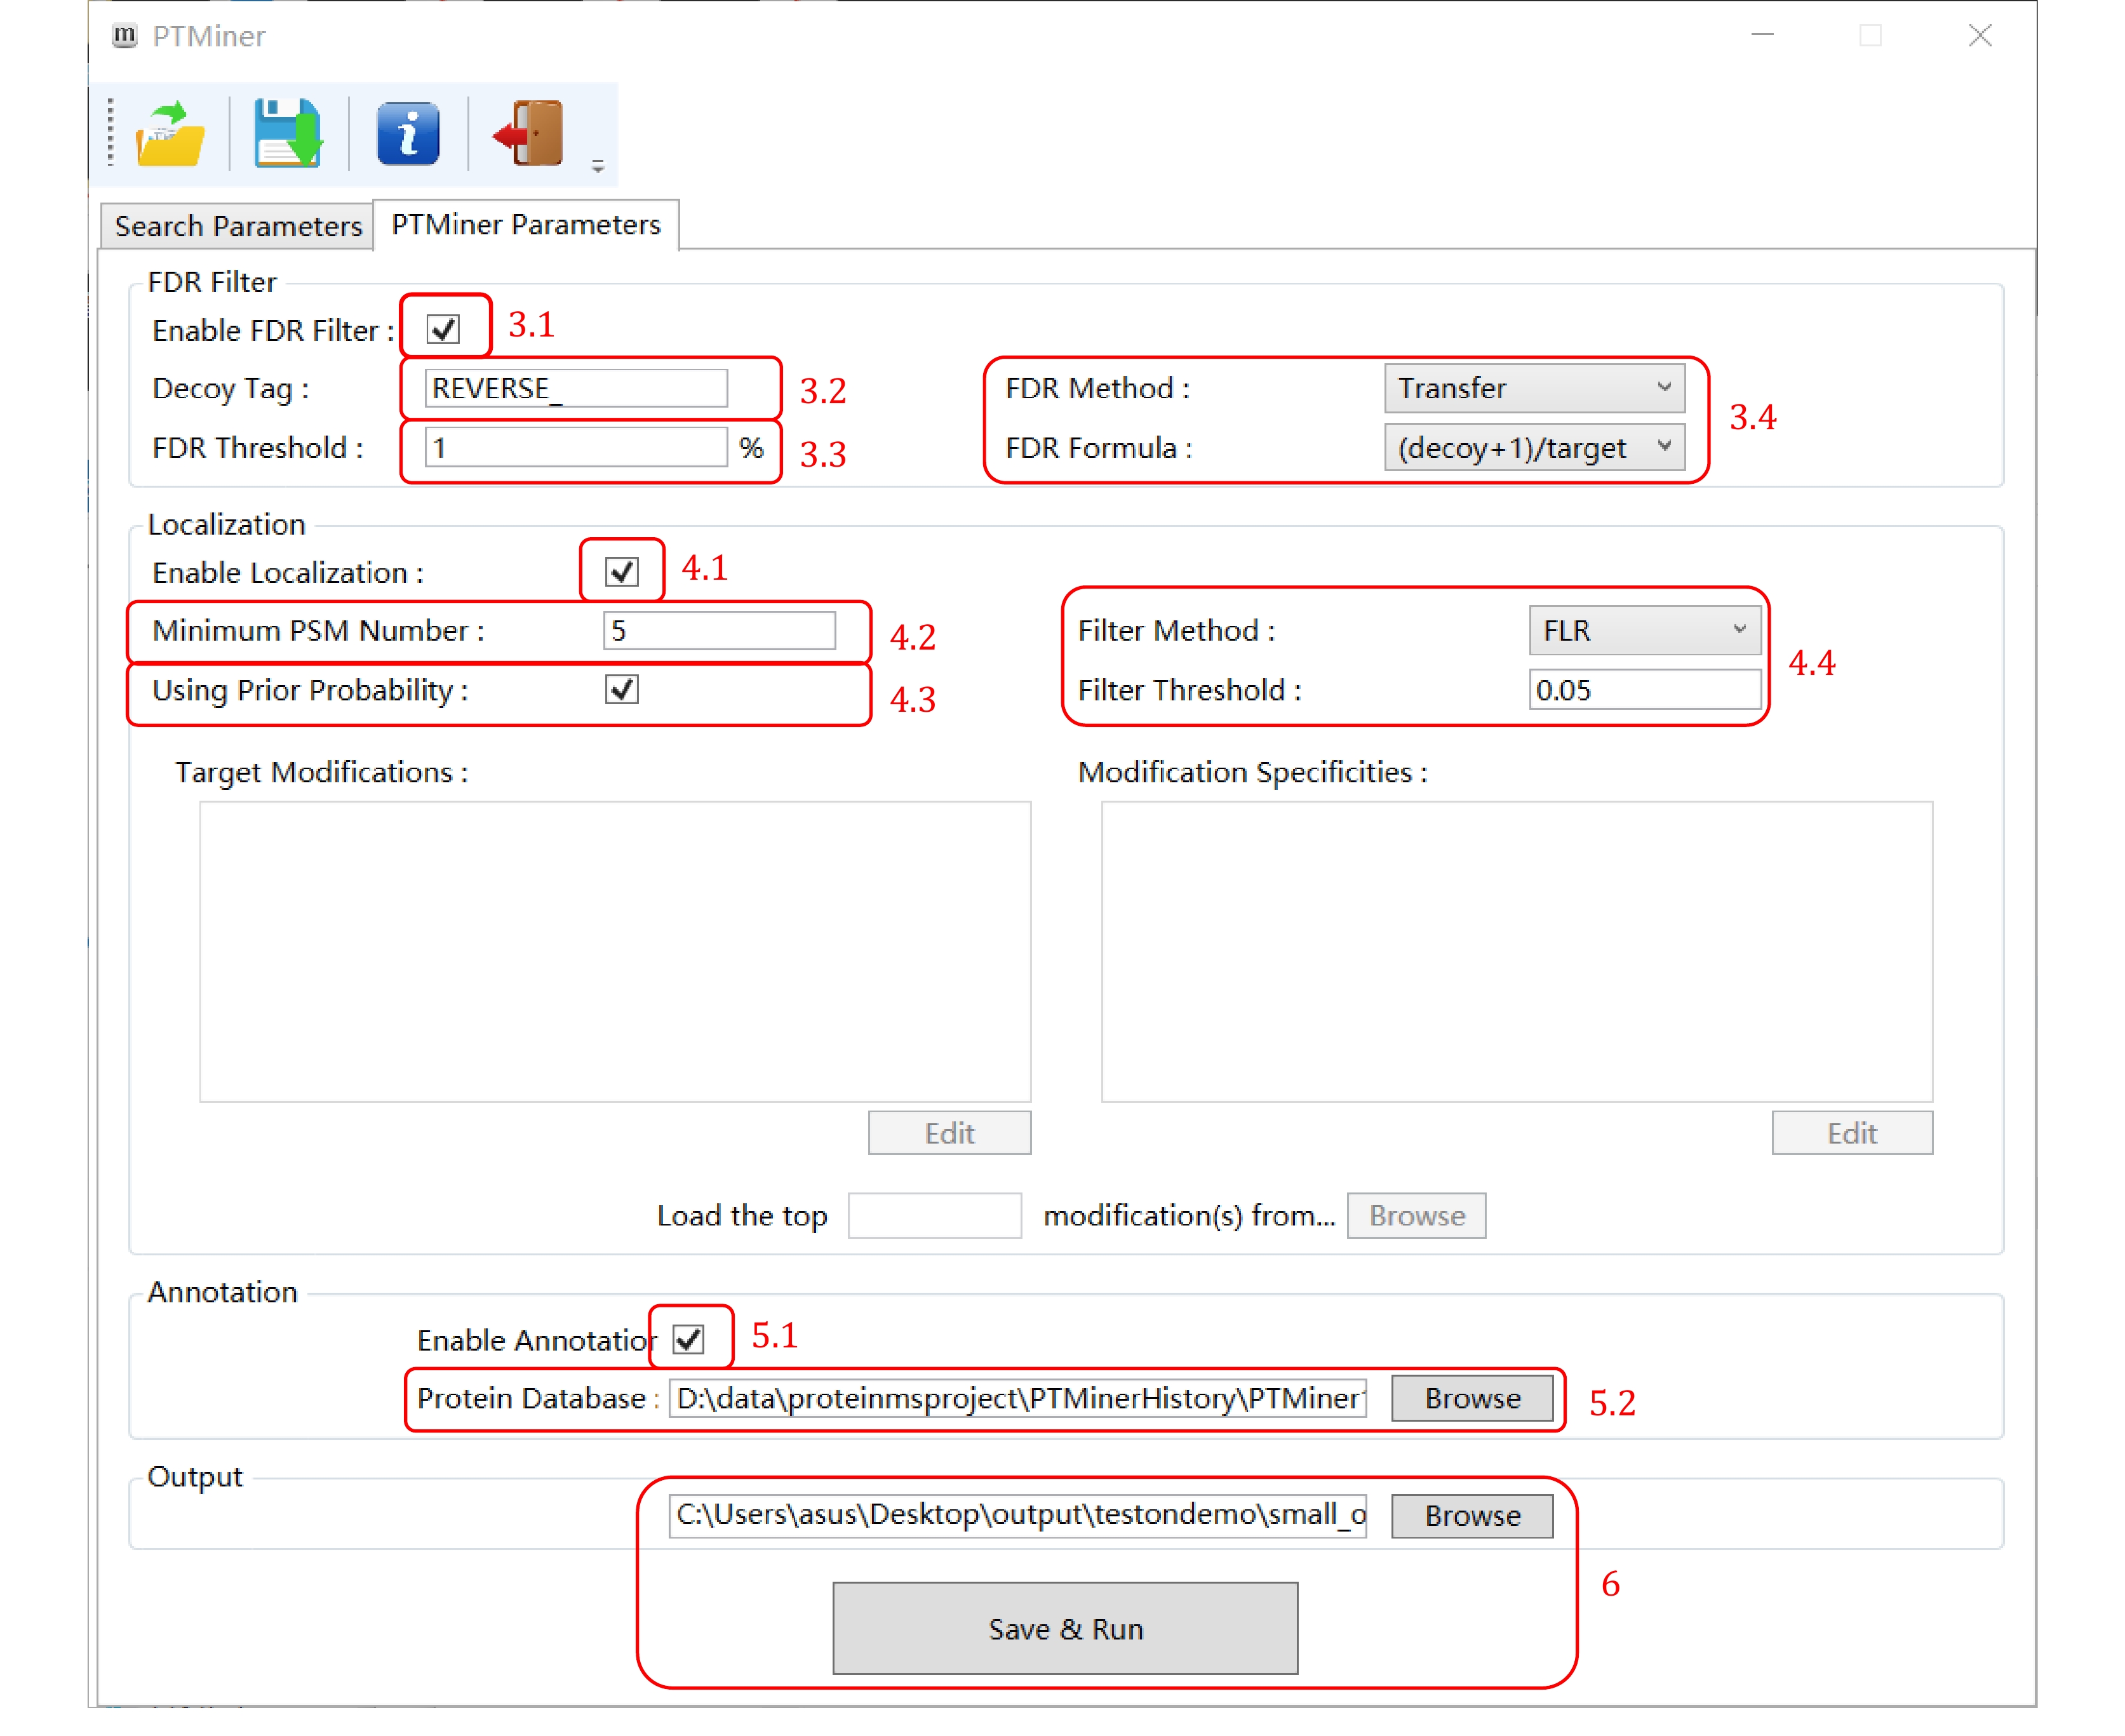
Figure 3. Setting the PTMiner parameters (open search)
-
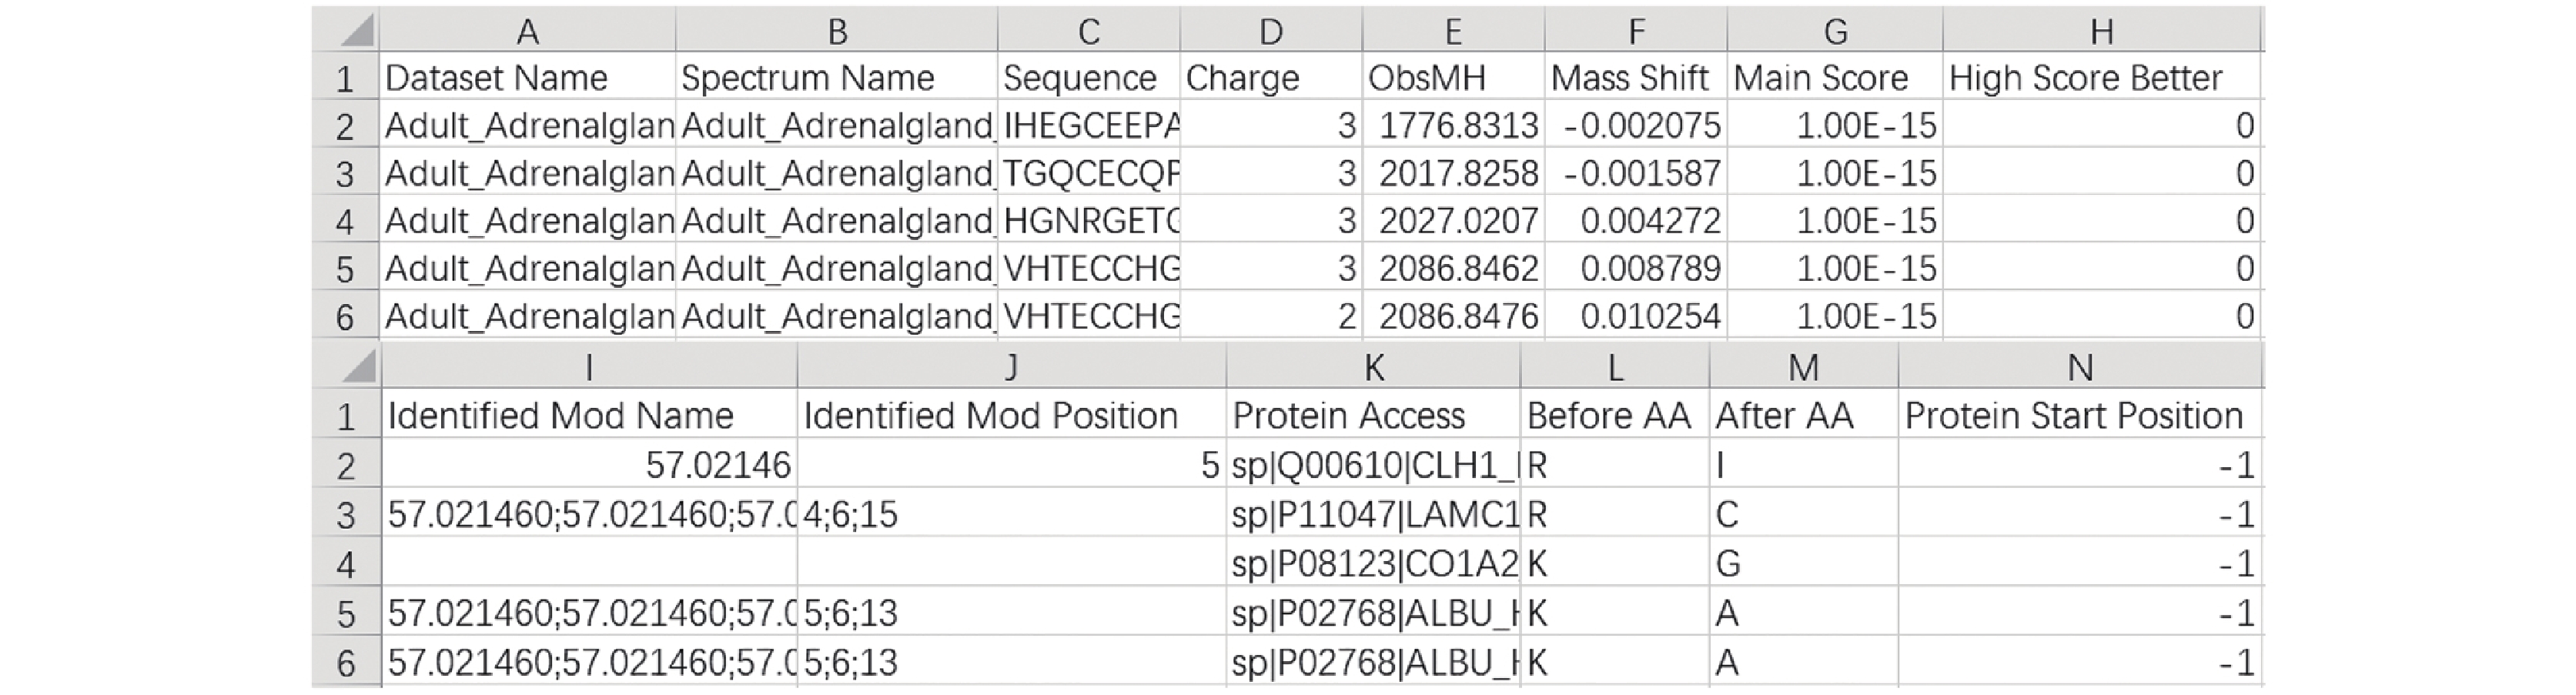
Figure 4. An example of filtered_result.txt displayed by Excel. Since one line of the original result file is too wide to display, it is cut into two lines to show here
-
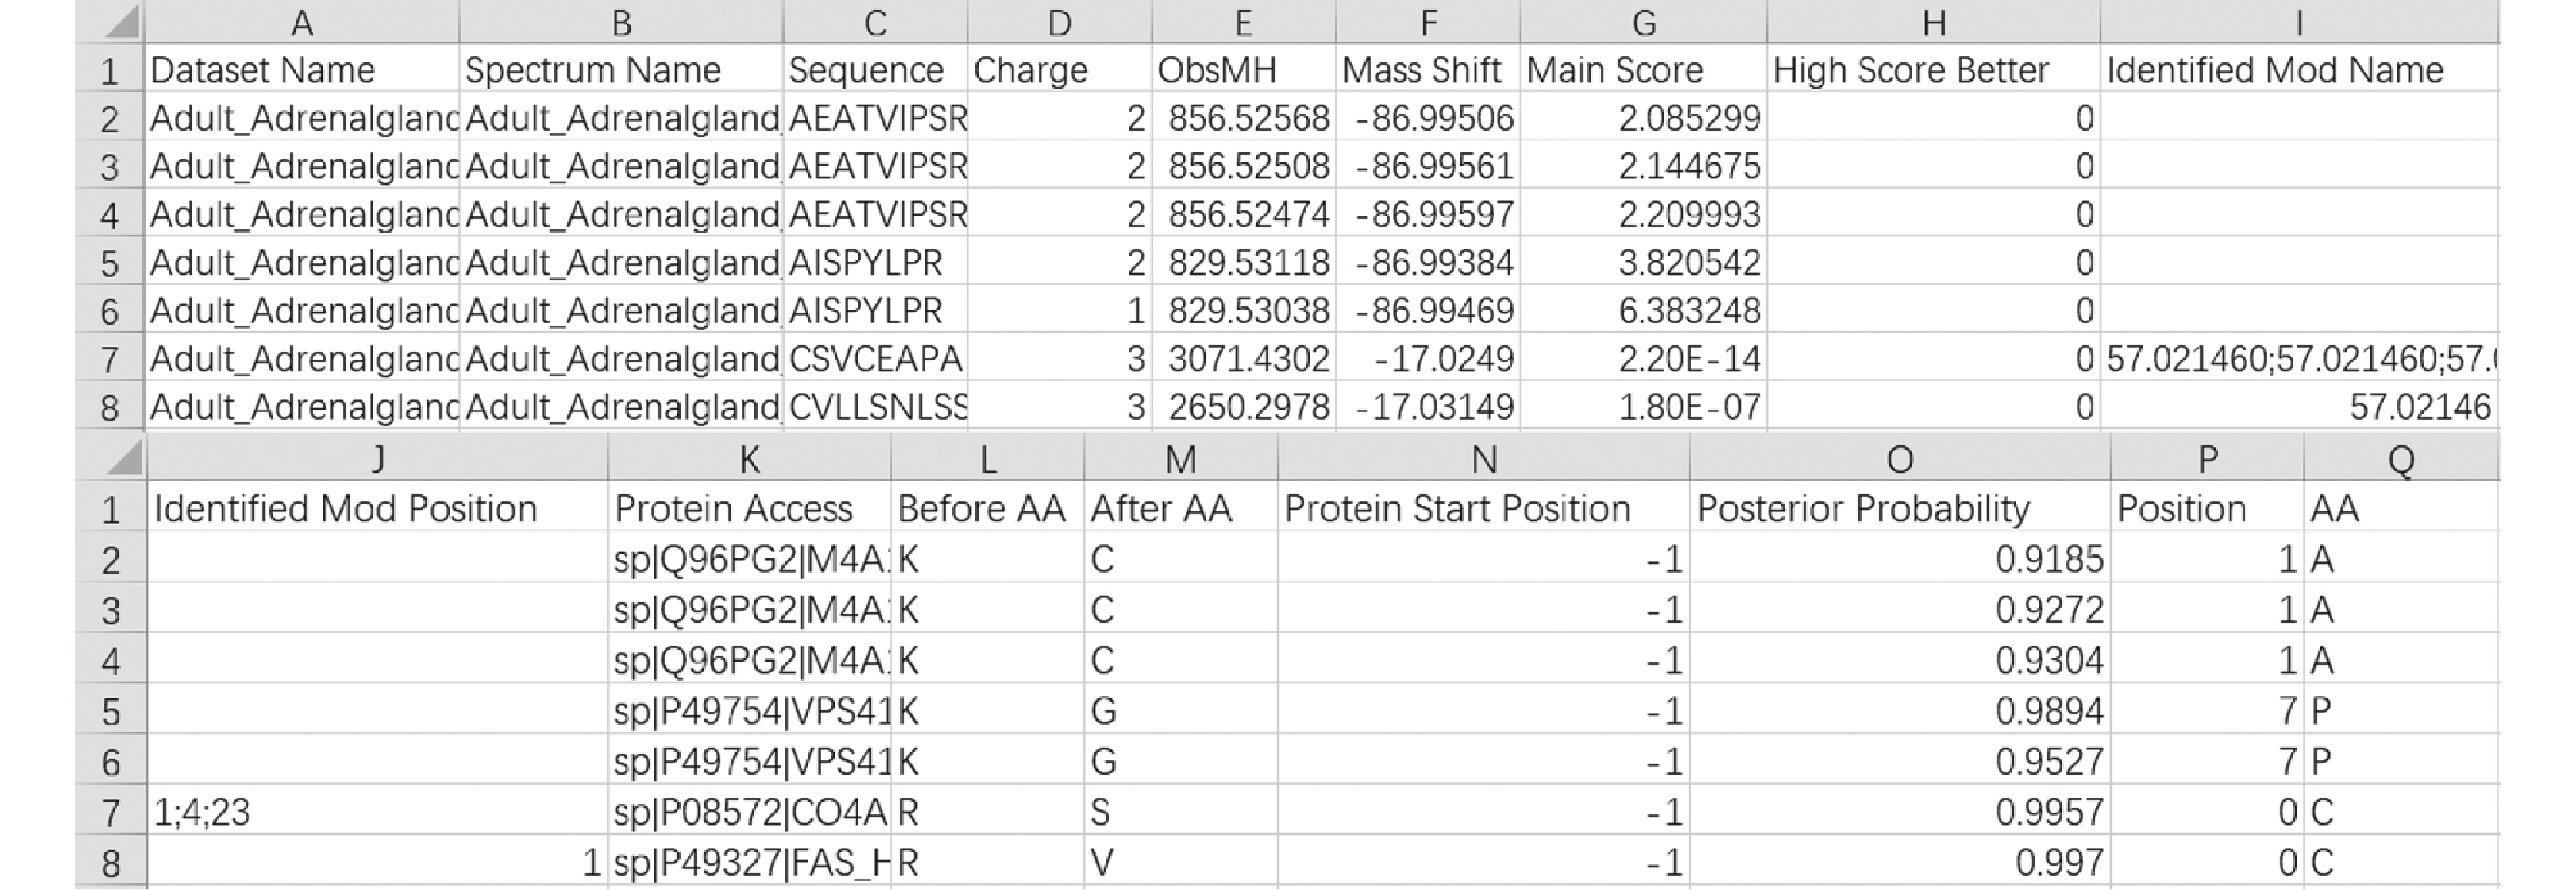
Figure 5. An example loc_result.txt displayed by Excel. Since one line of the original result file is too wide to display, it is cut into two lines to show here
-
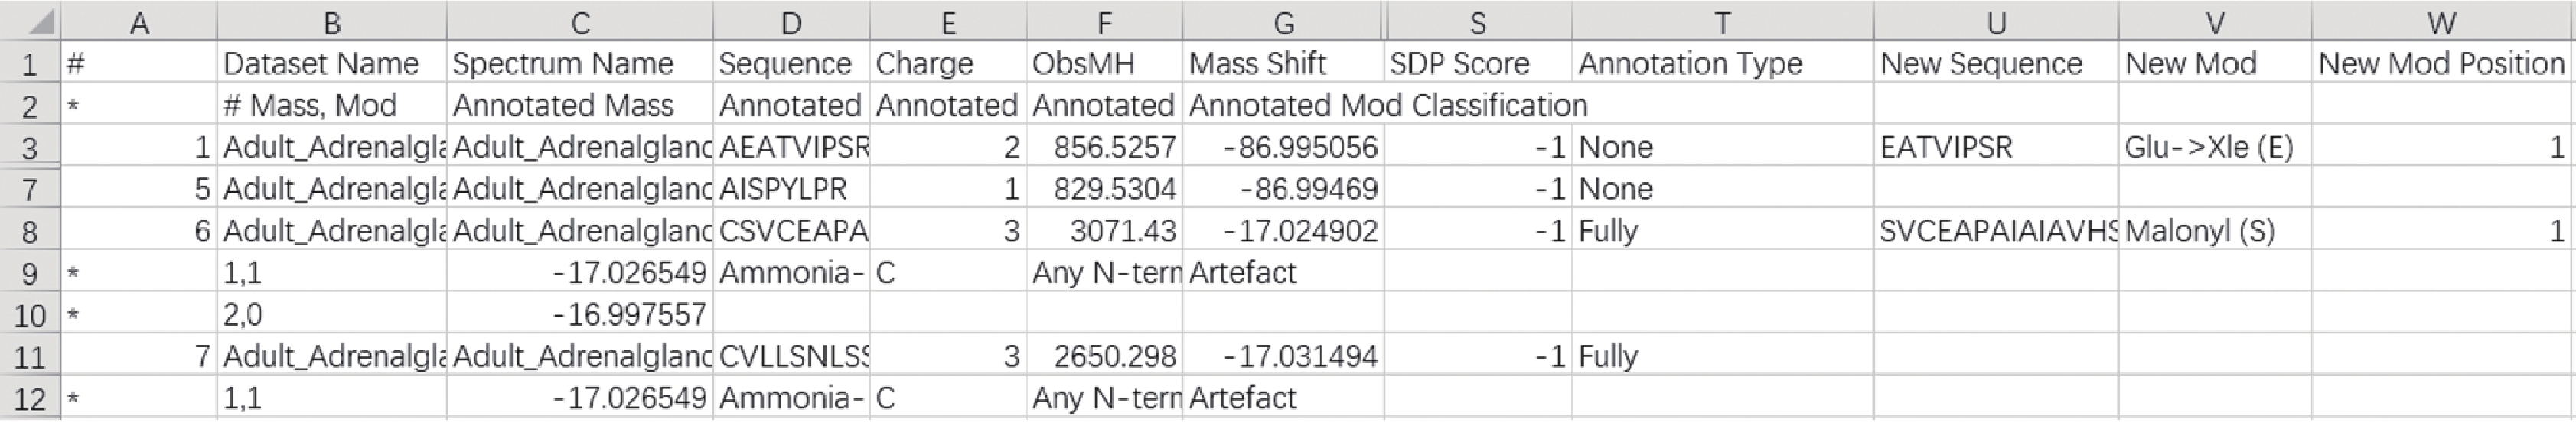
Figure 6. An example anno_result.txt displayed by Excel. Since one line of the original result file is too wide to display, the middle part of the lines are omitted here
-
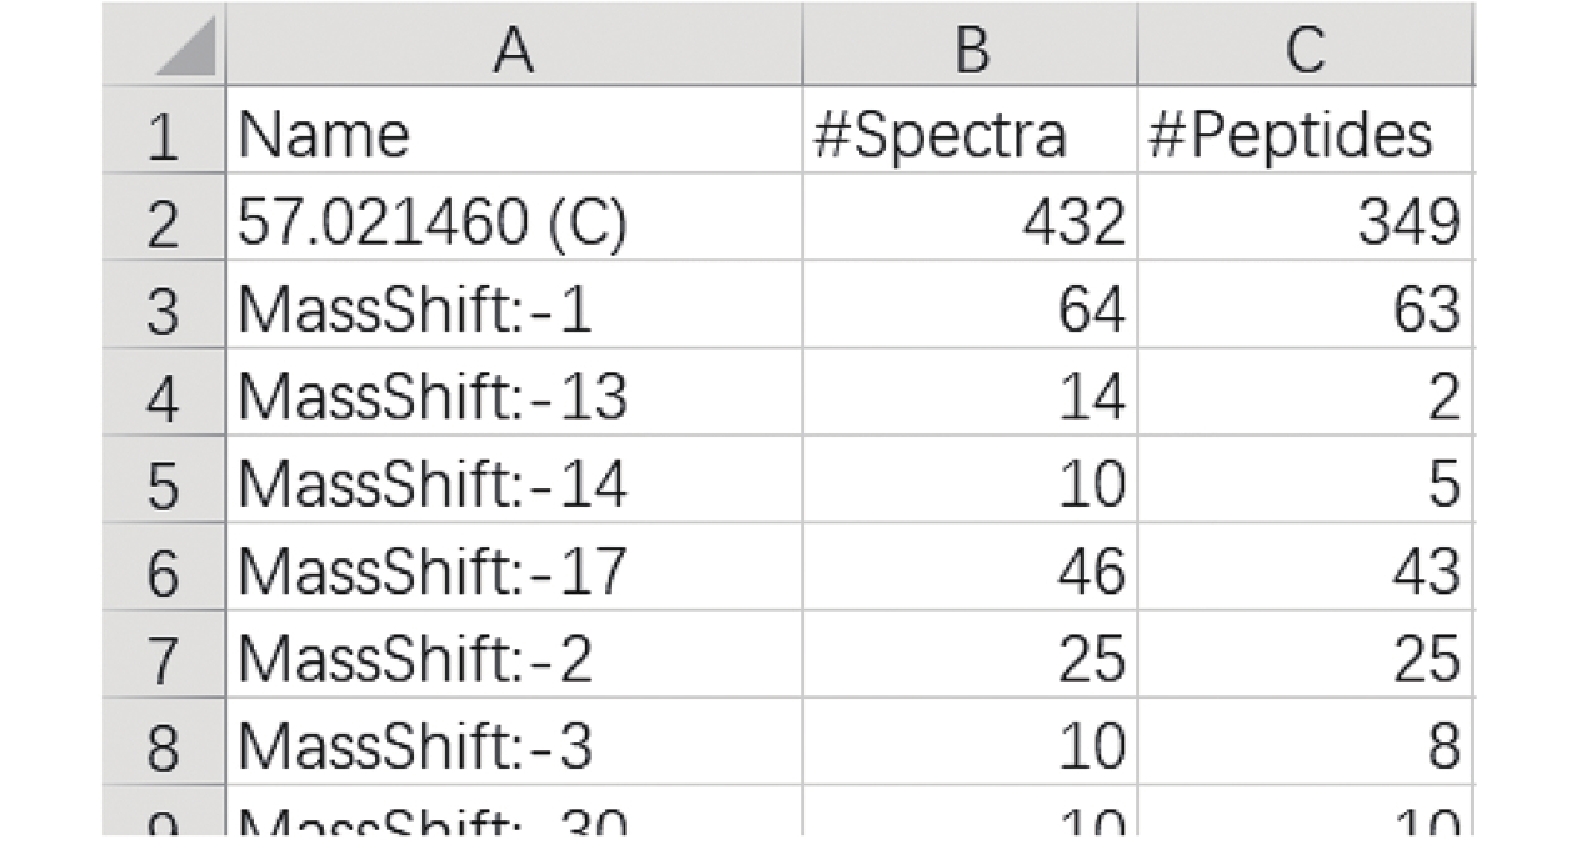
Figure 7. An example filtered_summary.txt displayed by Excel
-
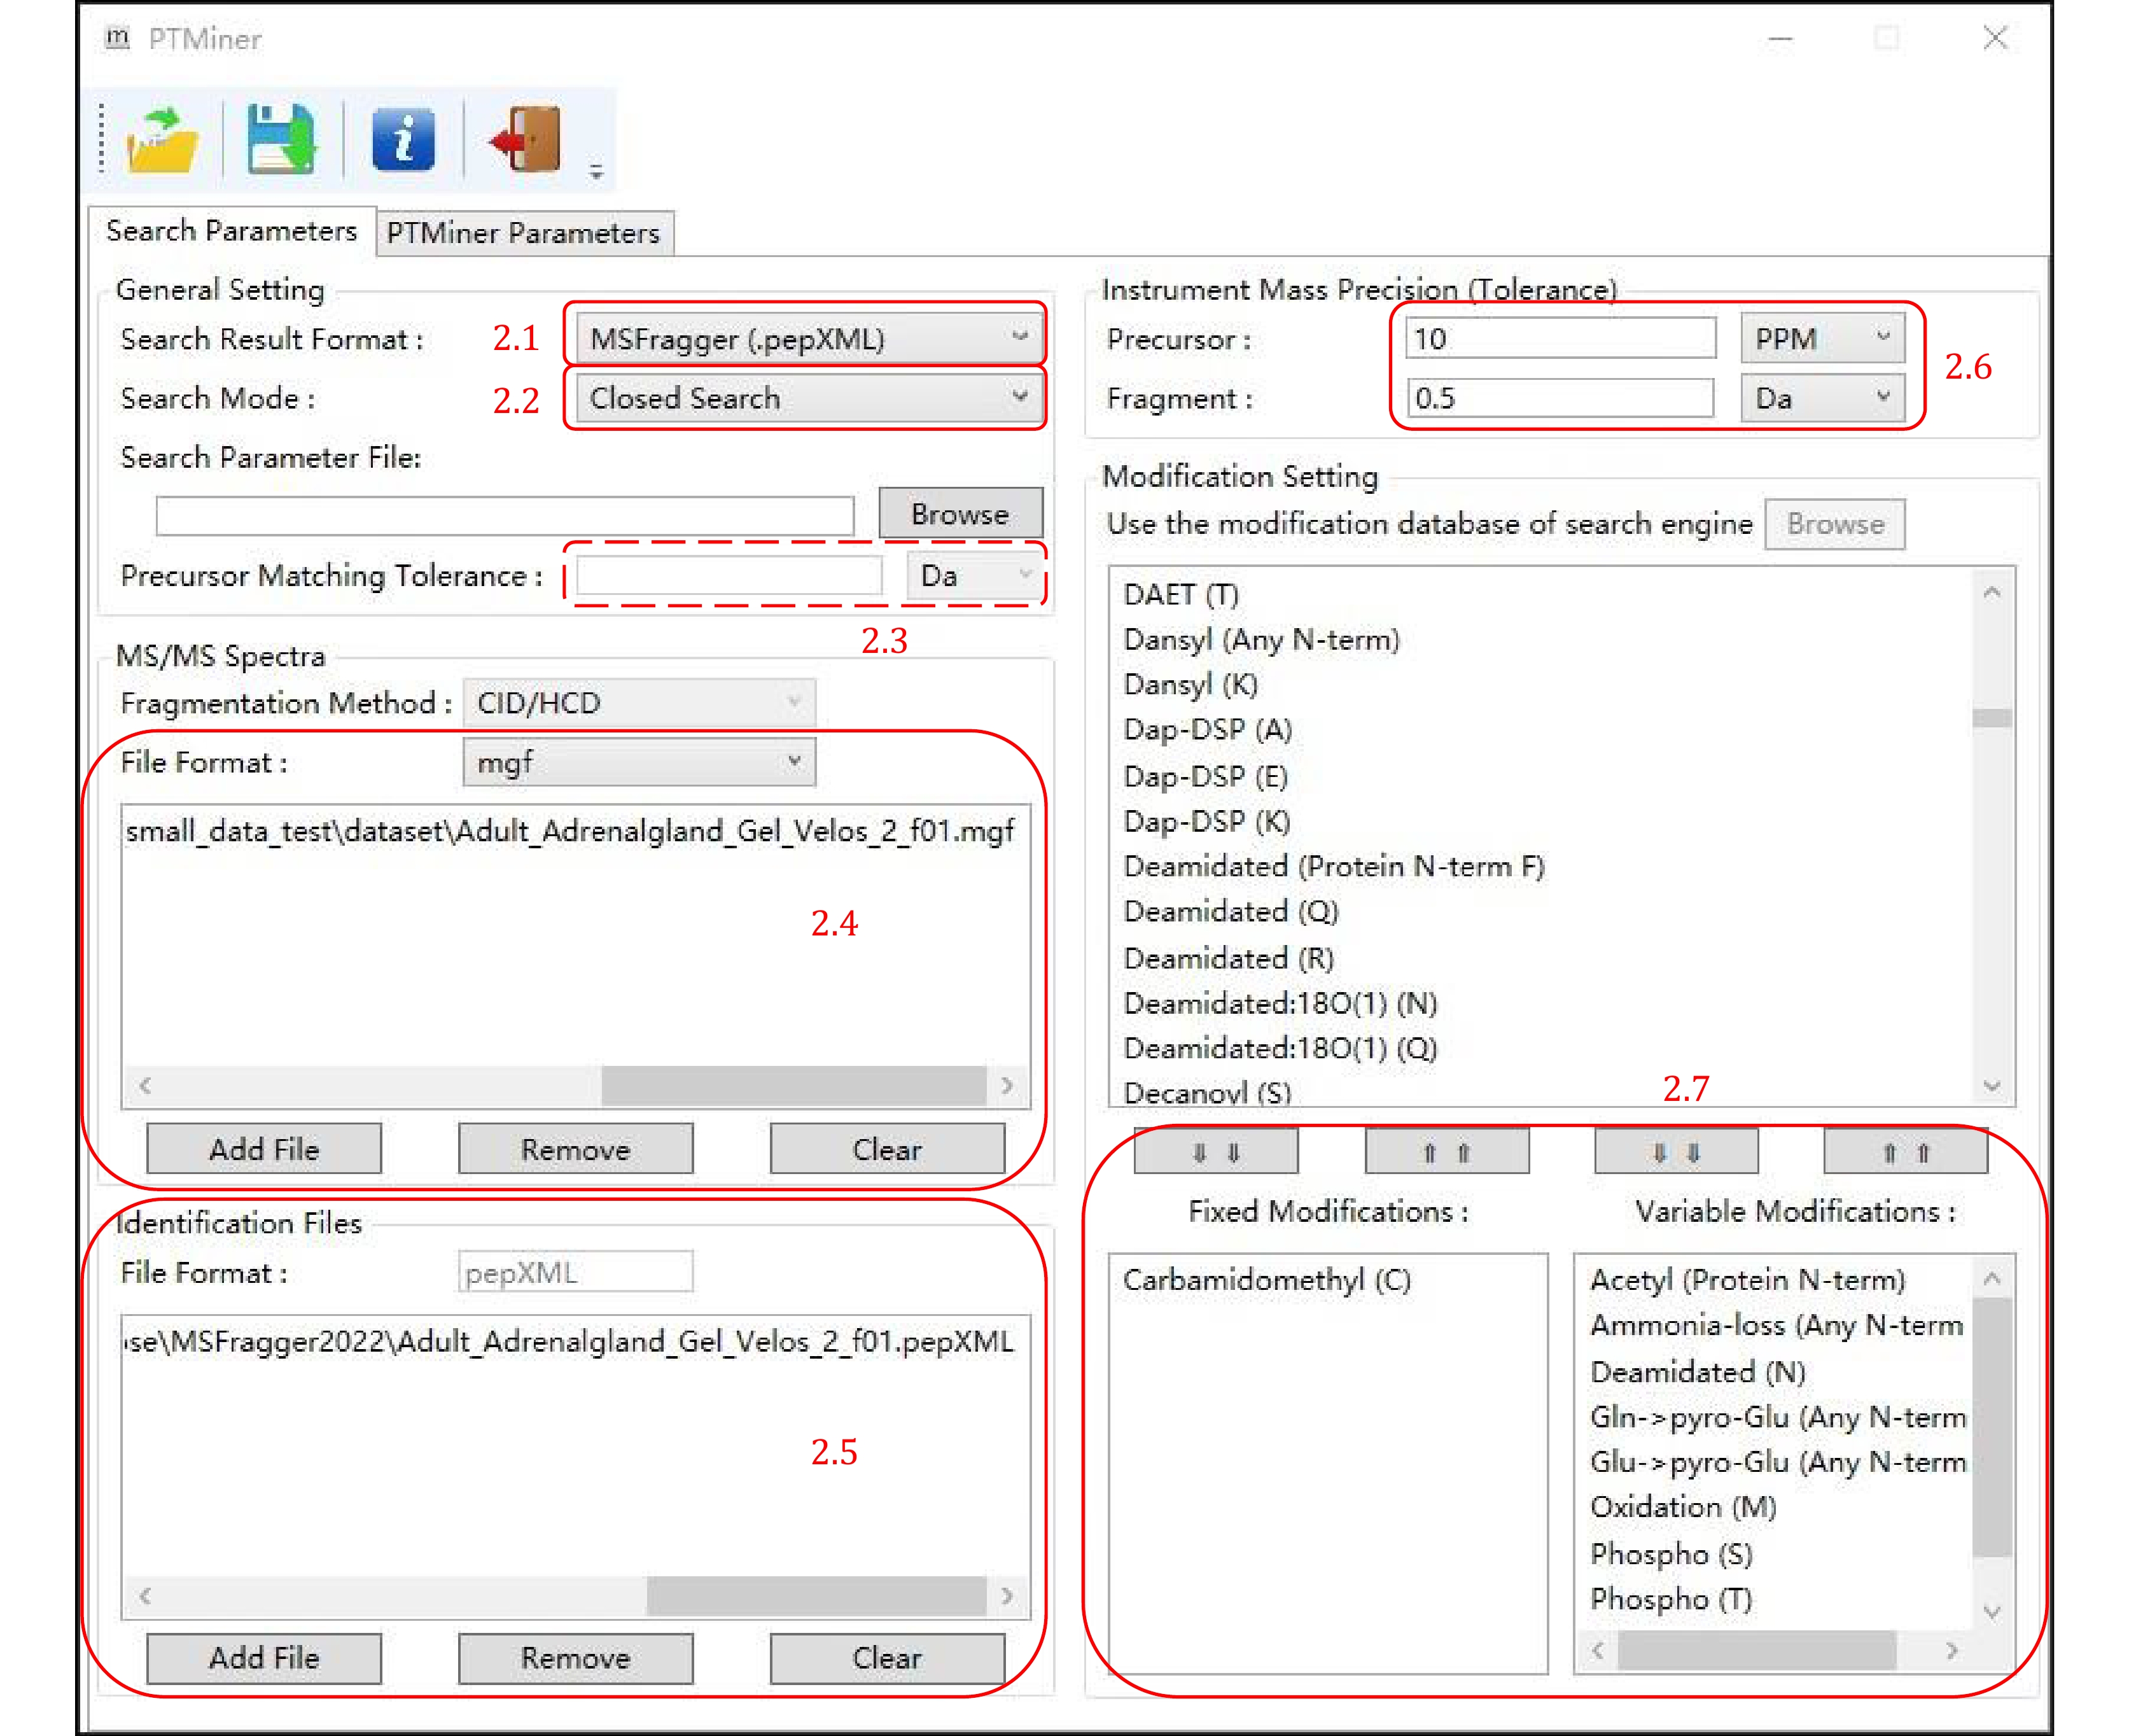
Figure 8. Setting the search parameters (closed search)
-
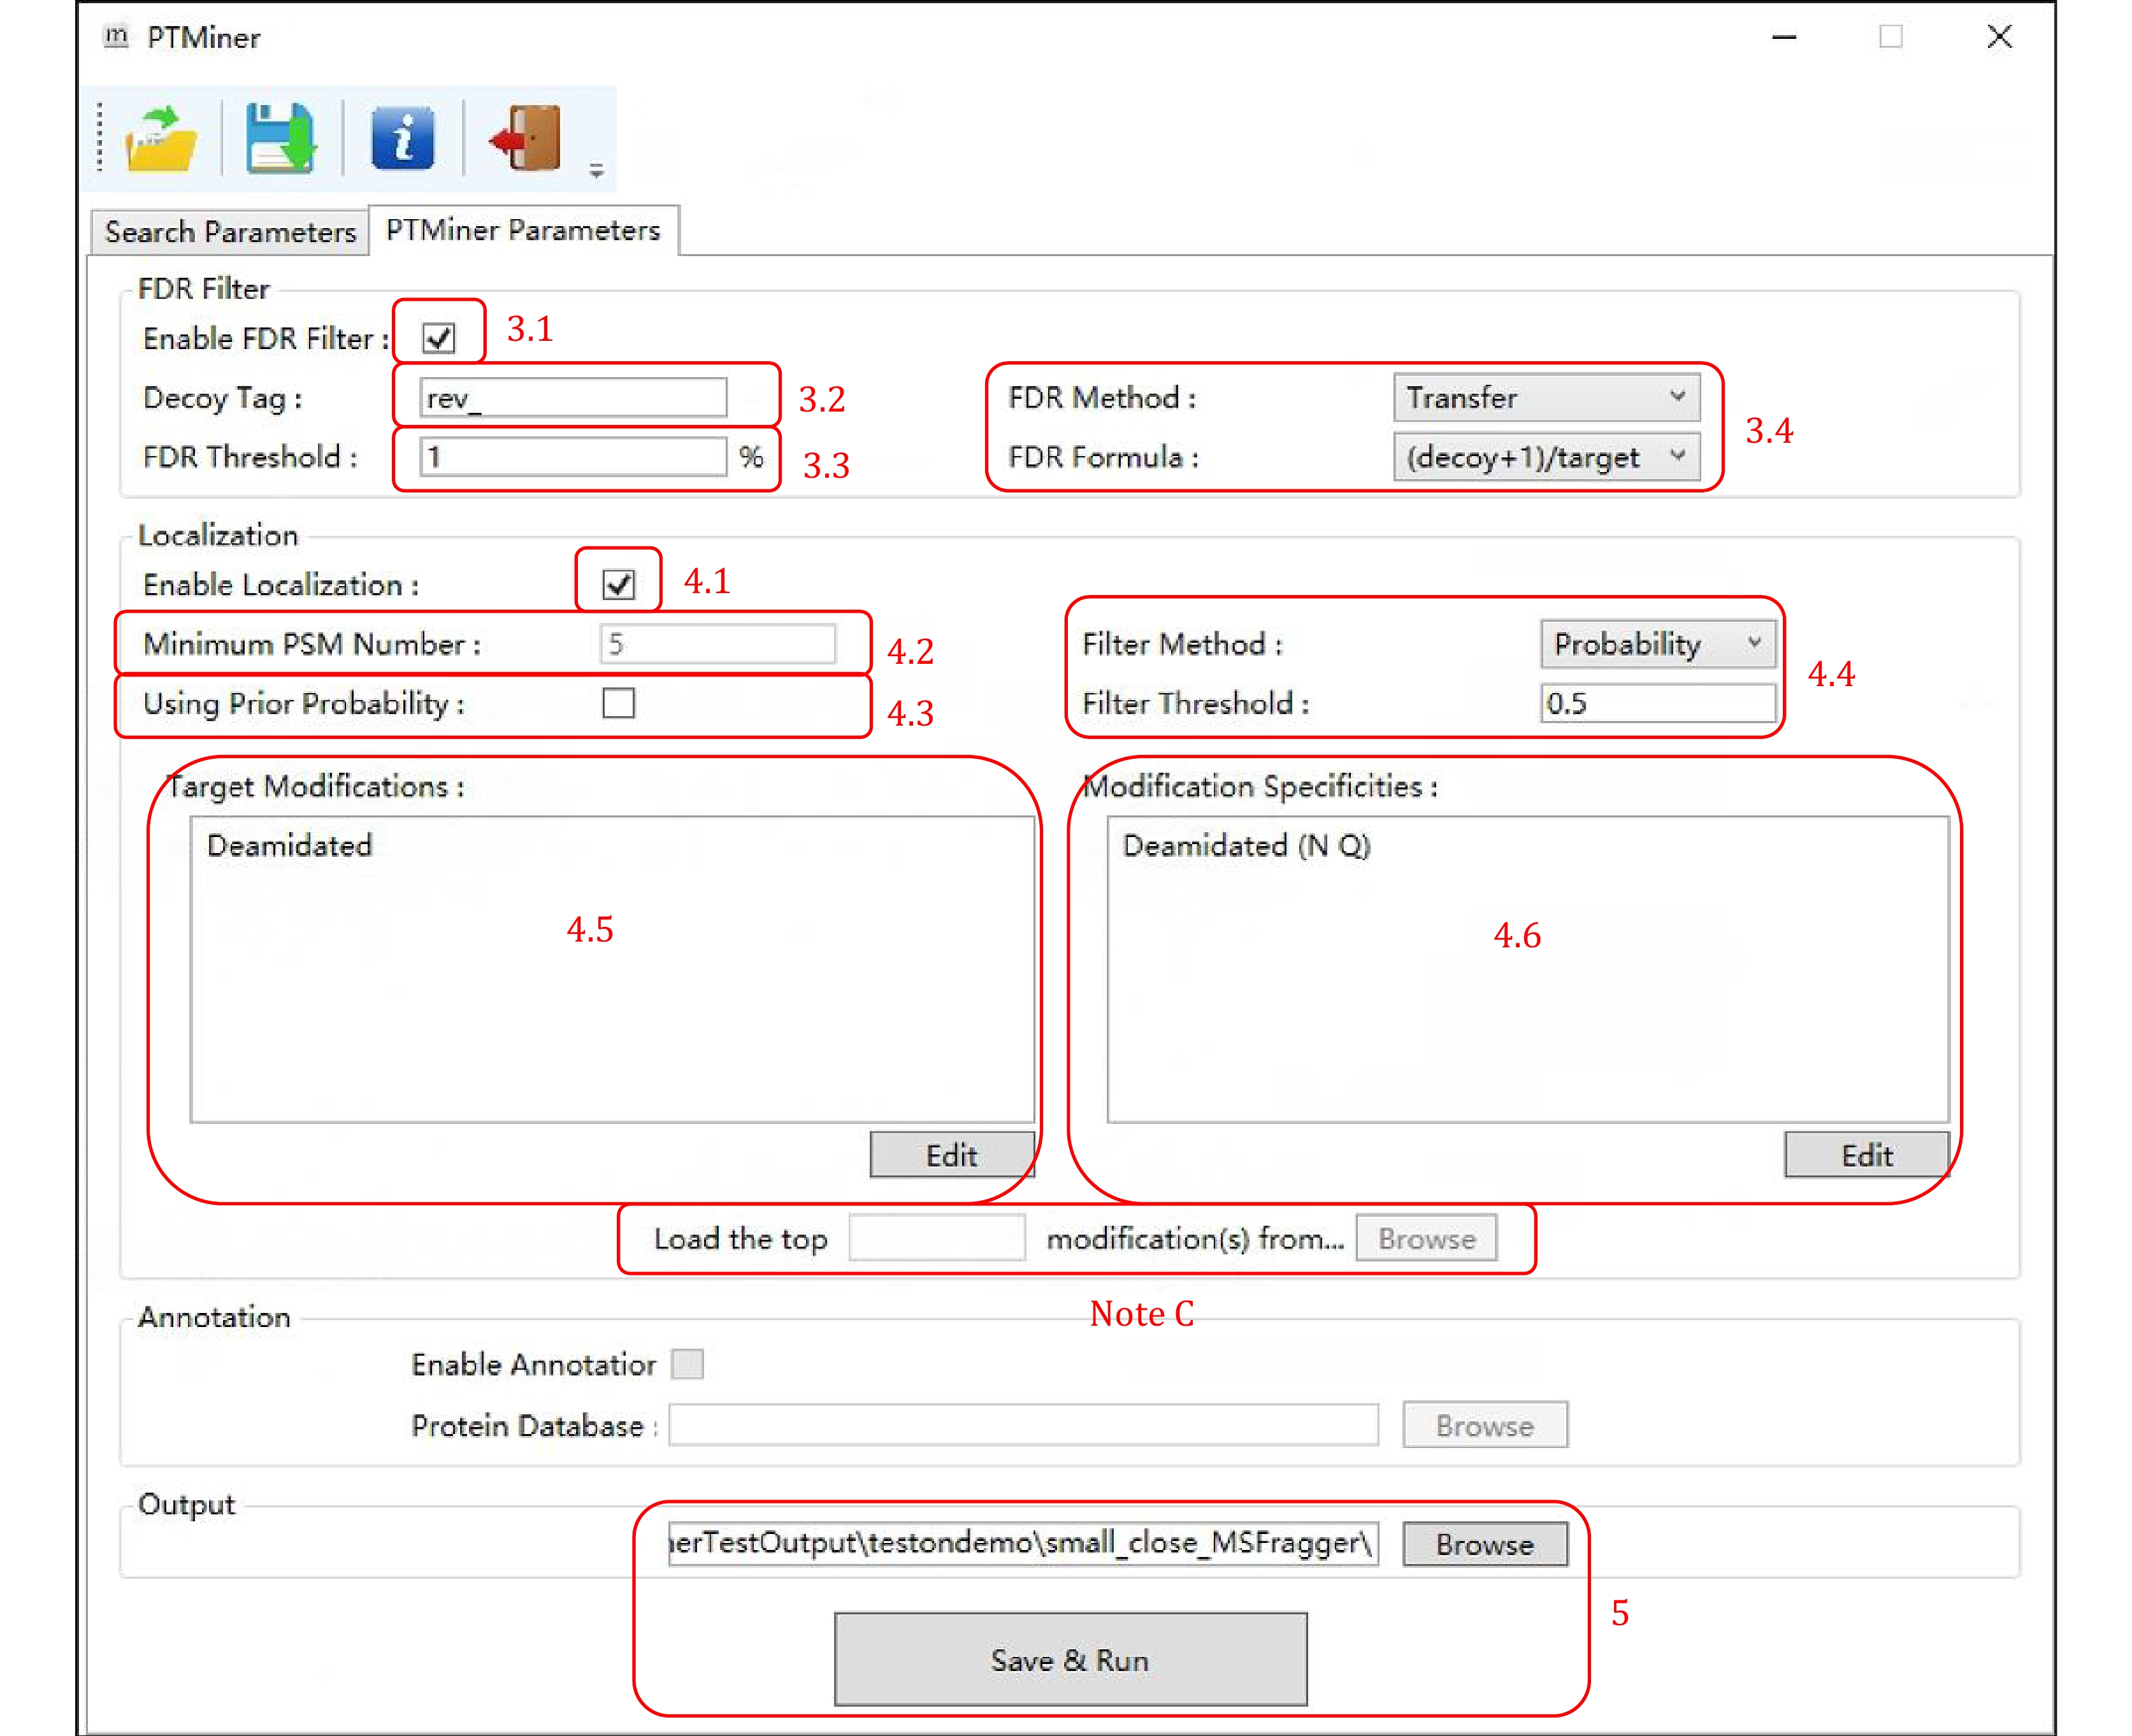
Figure 9. Setting the PTMiner parameters (closed search)
-
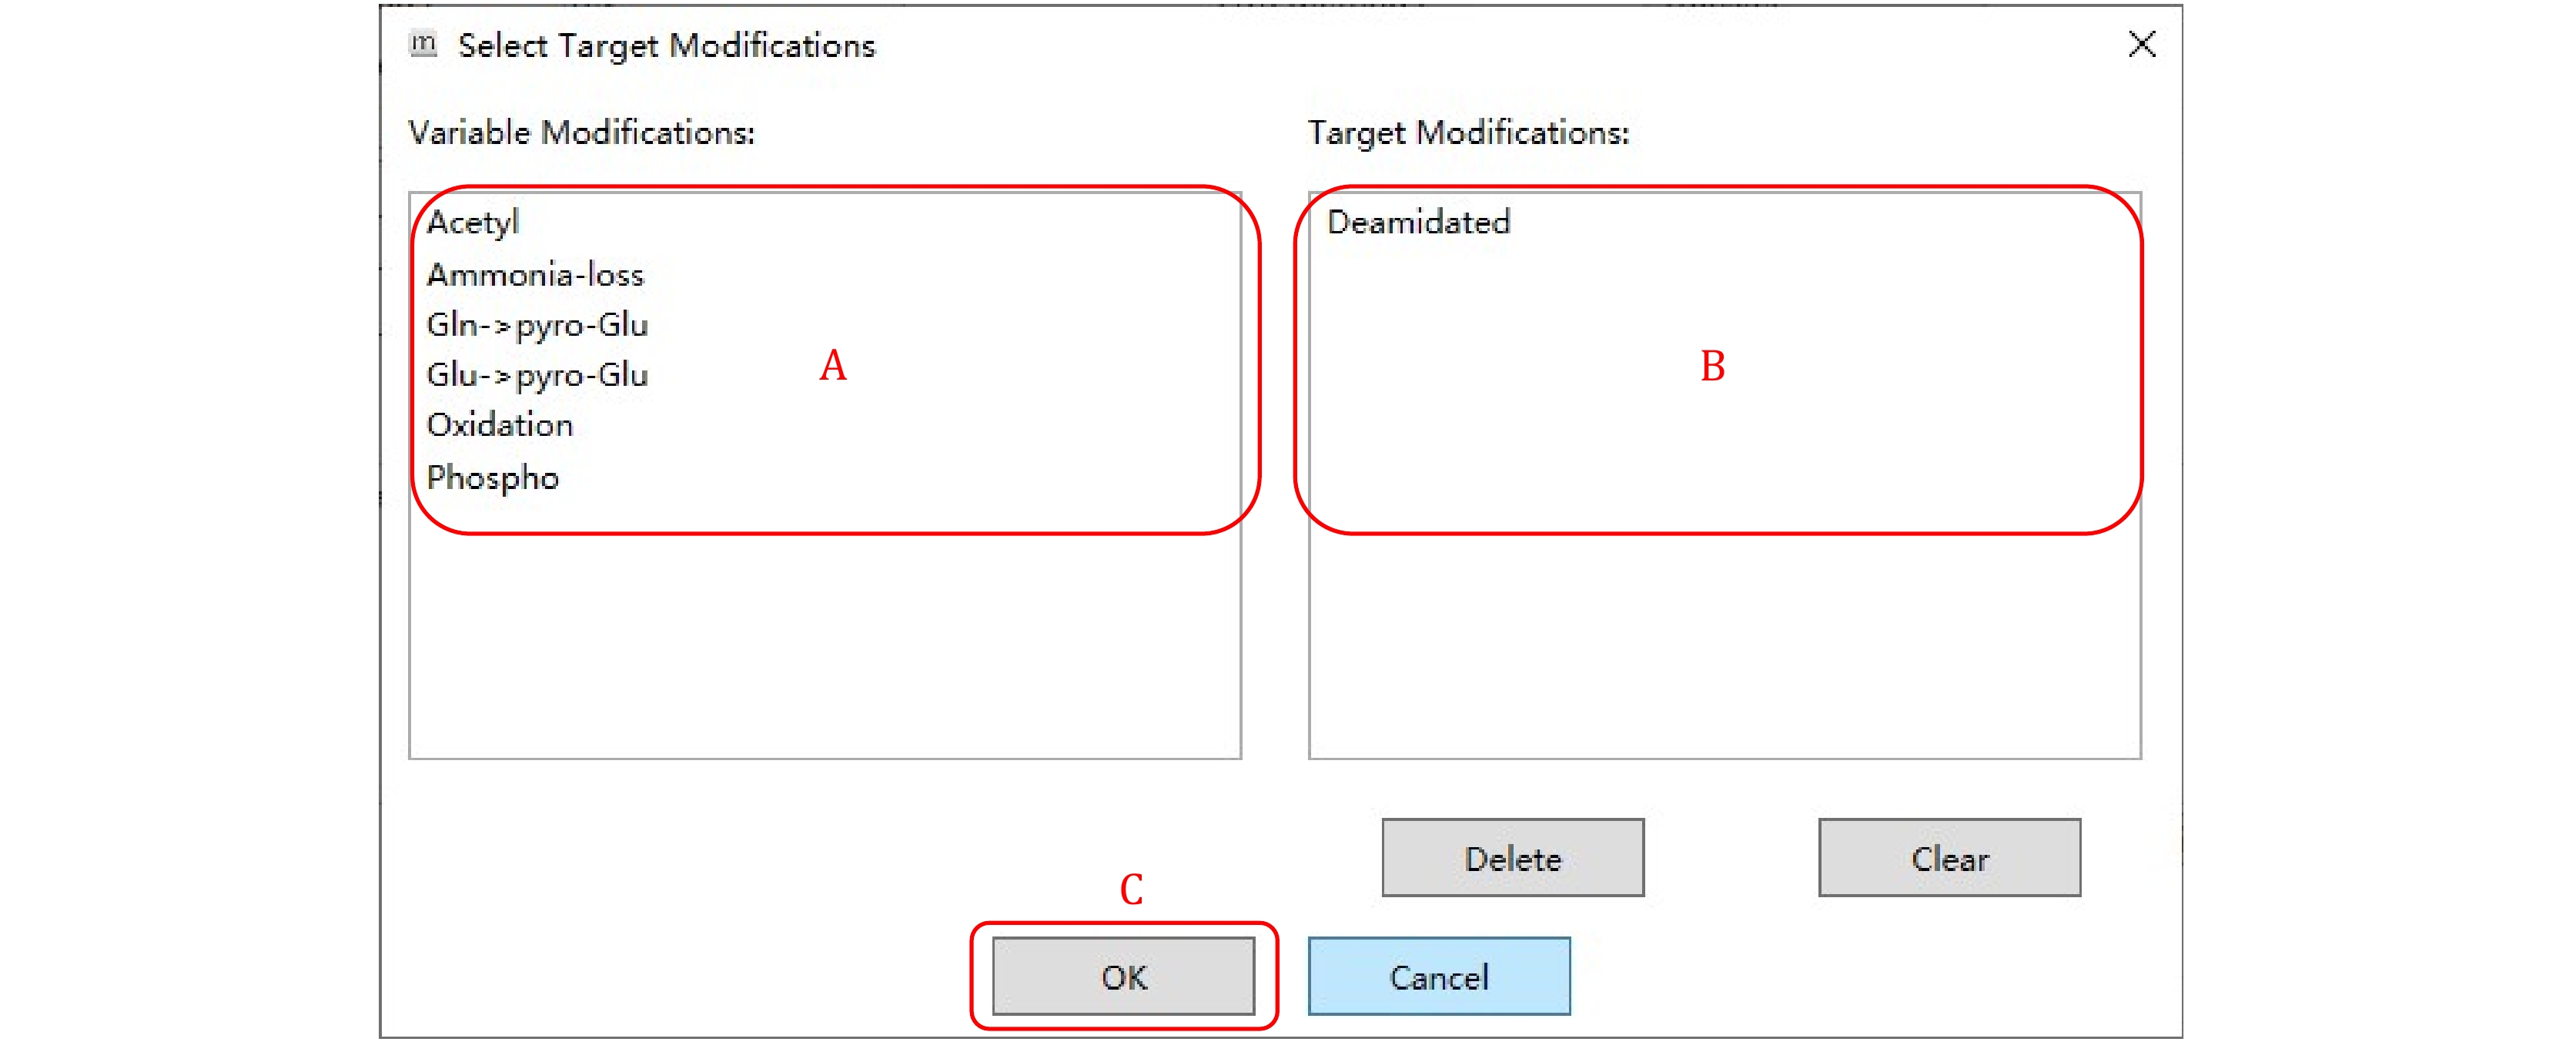
Figure 10. Selecting the target modifications
-
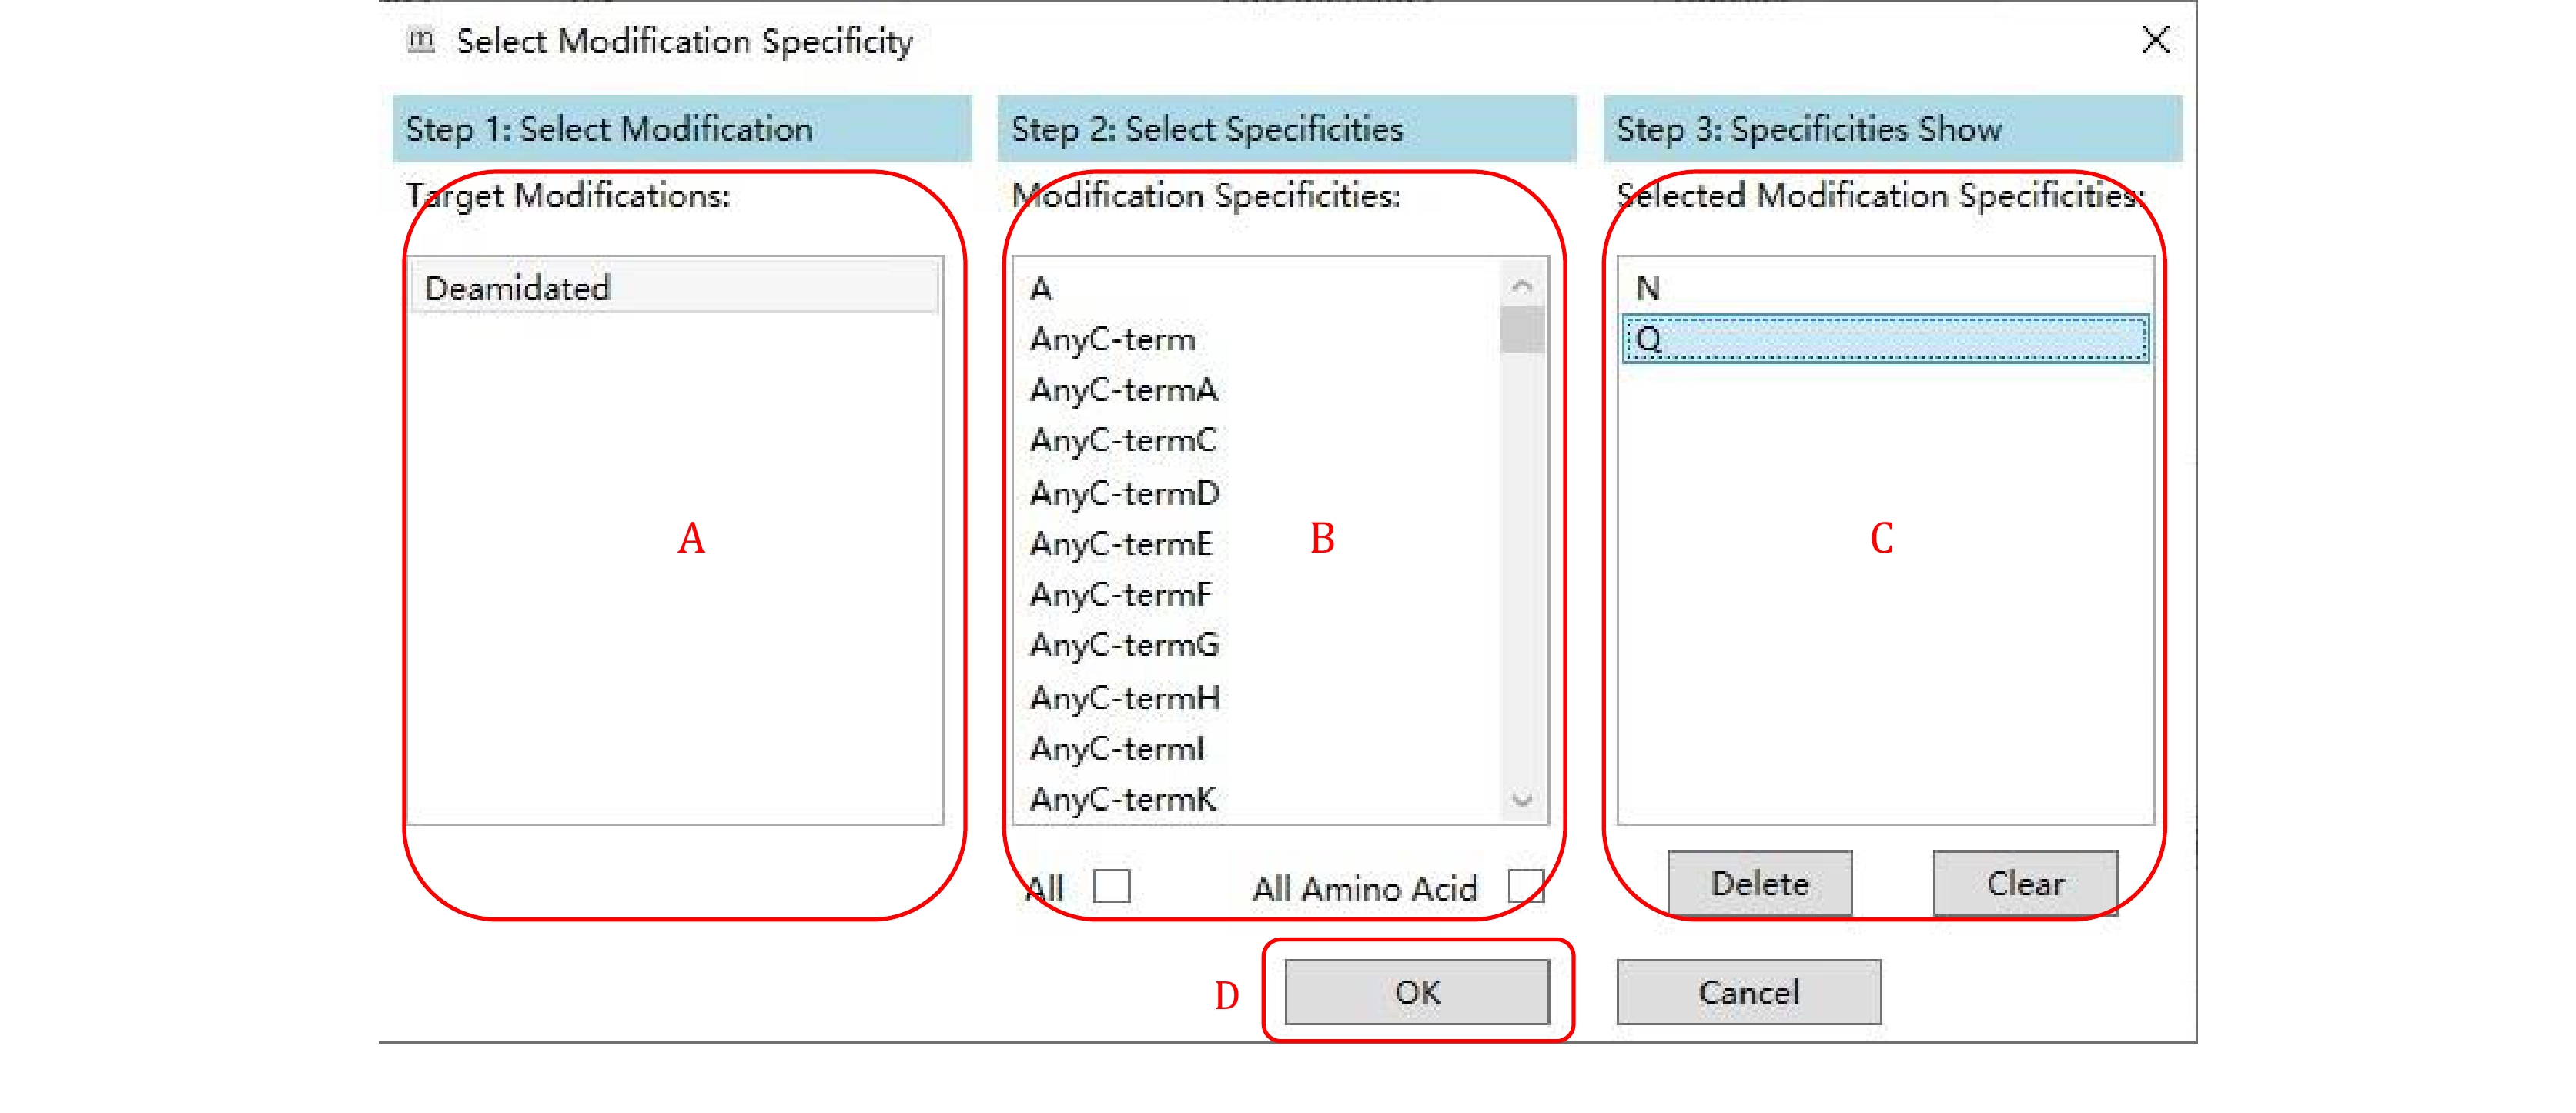
Figure 11. Selecting the site specificities for each modification
-
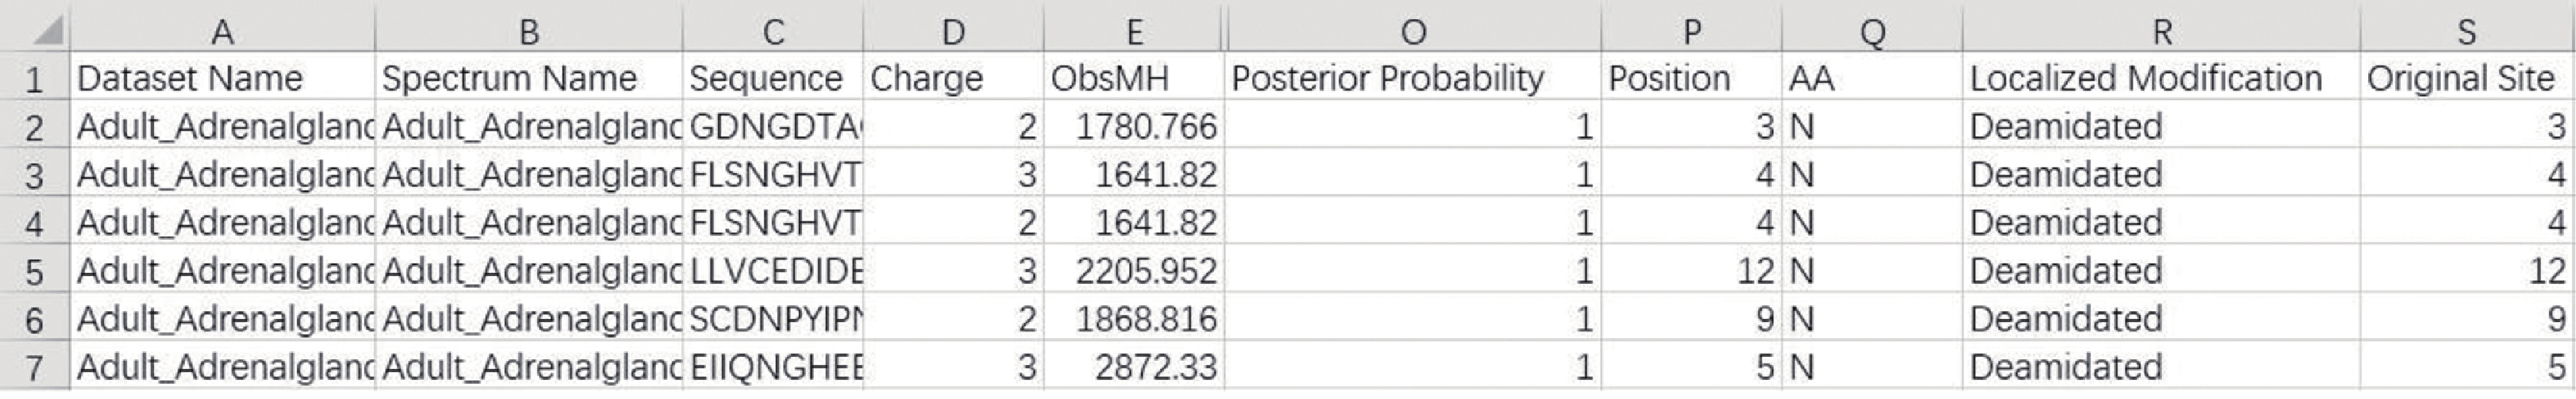
Figure 12. An example loc_result.txt displayed by Excel. Since one line of the original result file is too wide to display, the middle part of the lines are omitted here
Figure
12 ,Table
5 个