-
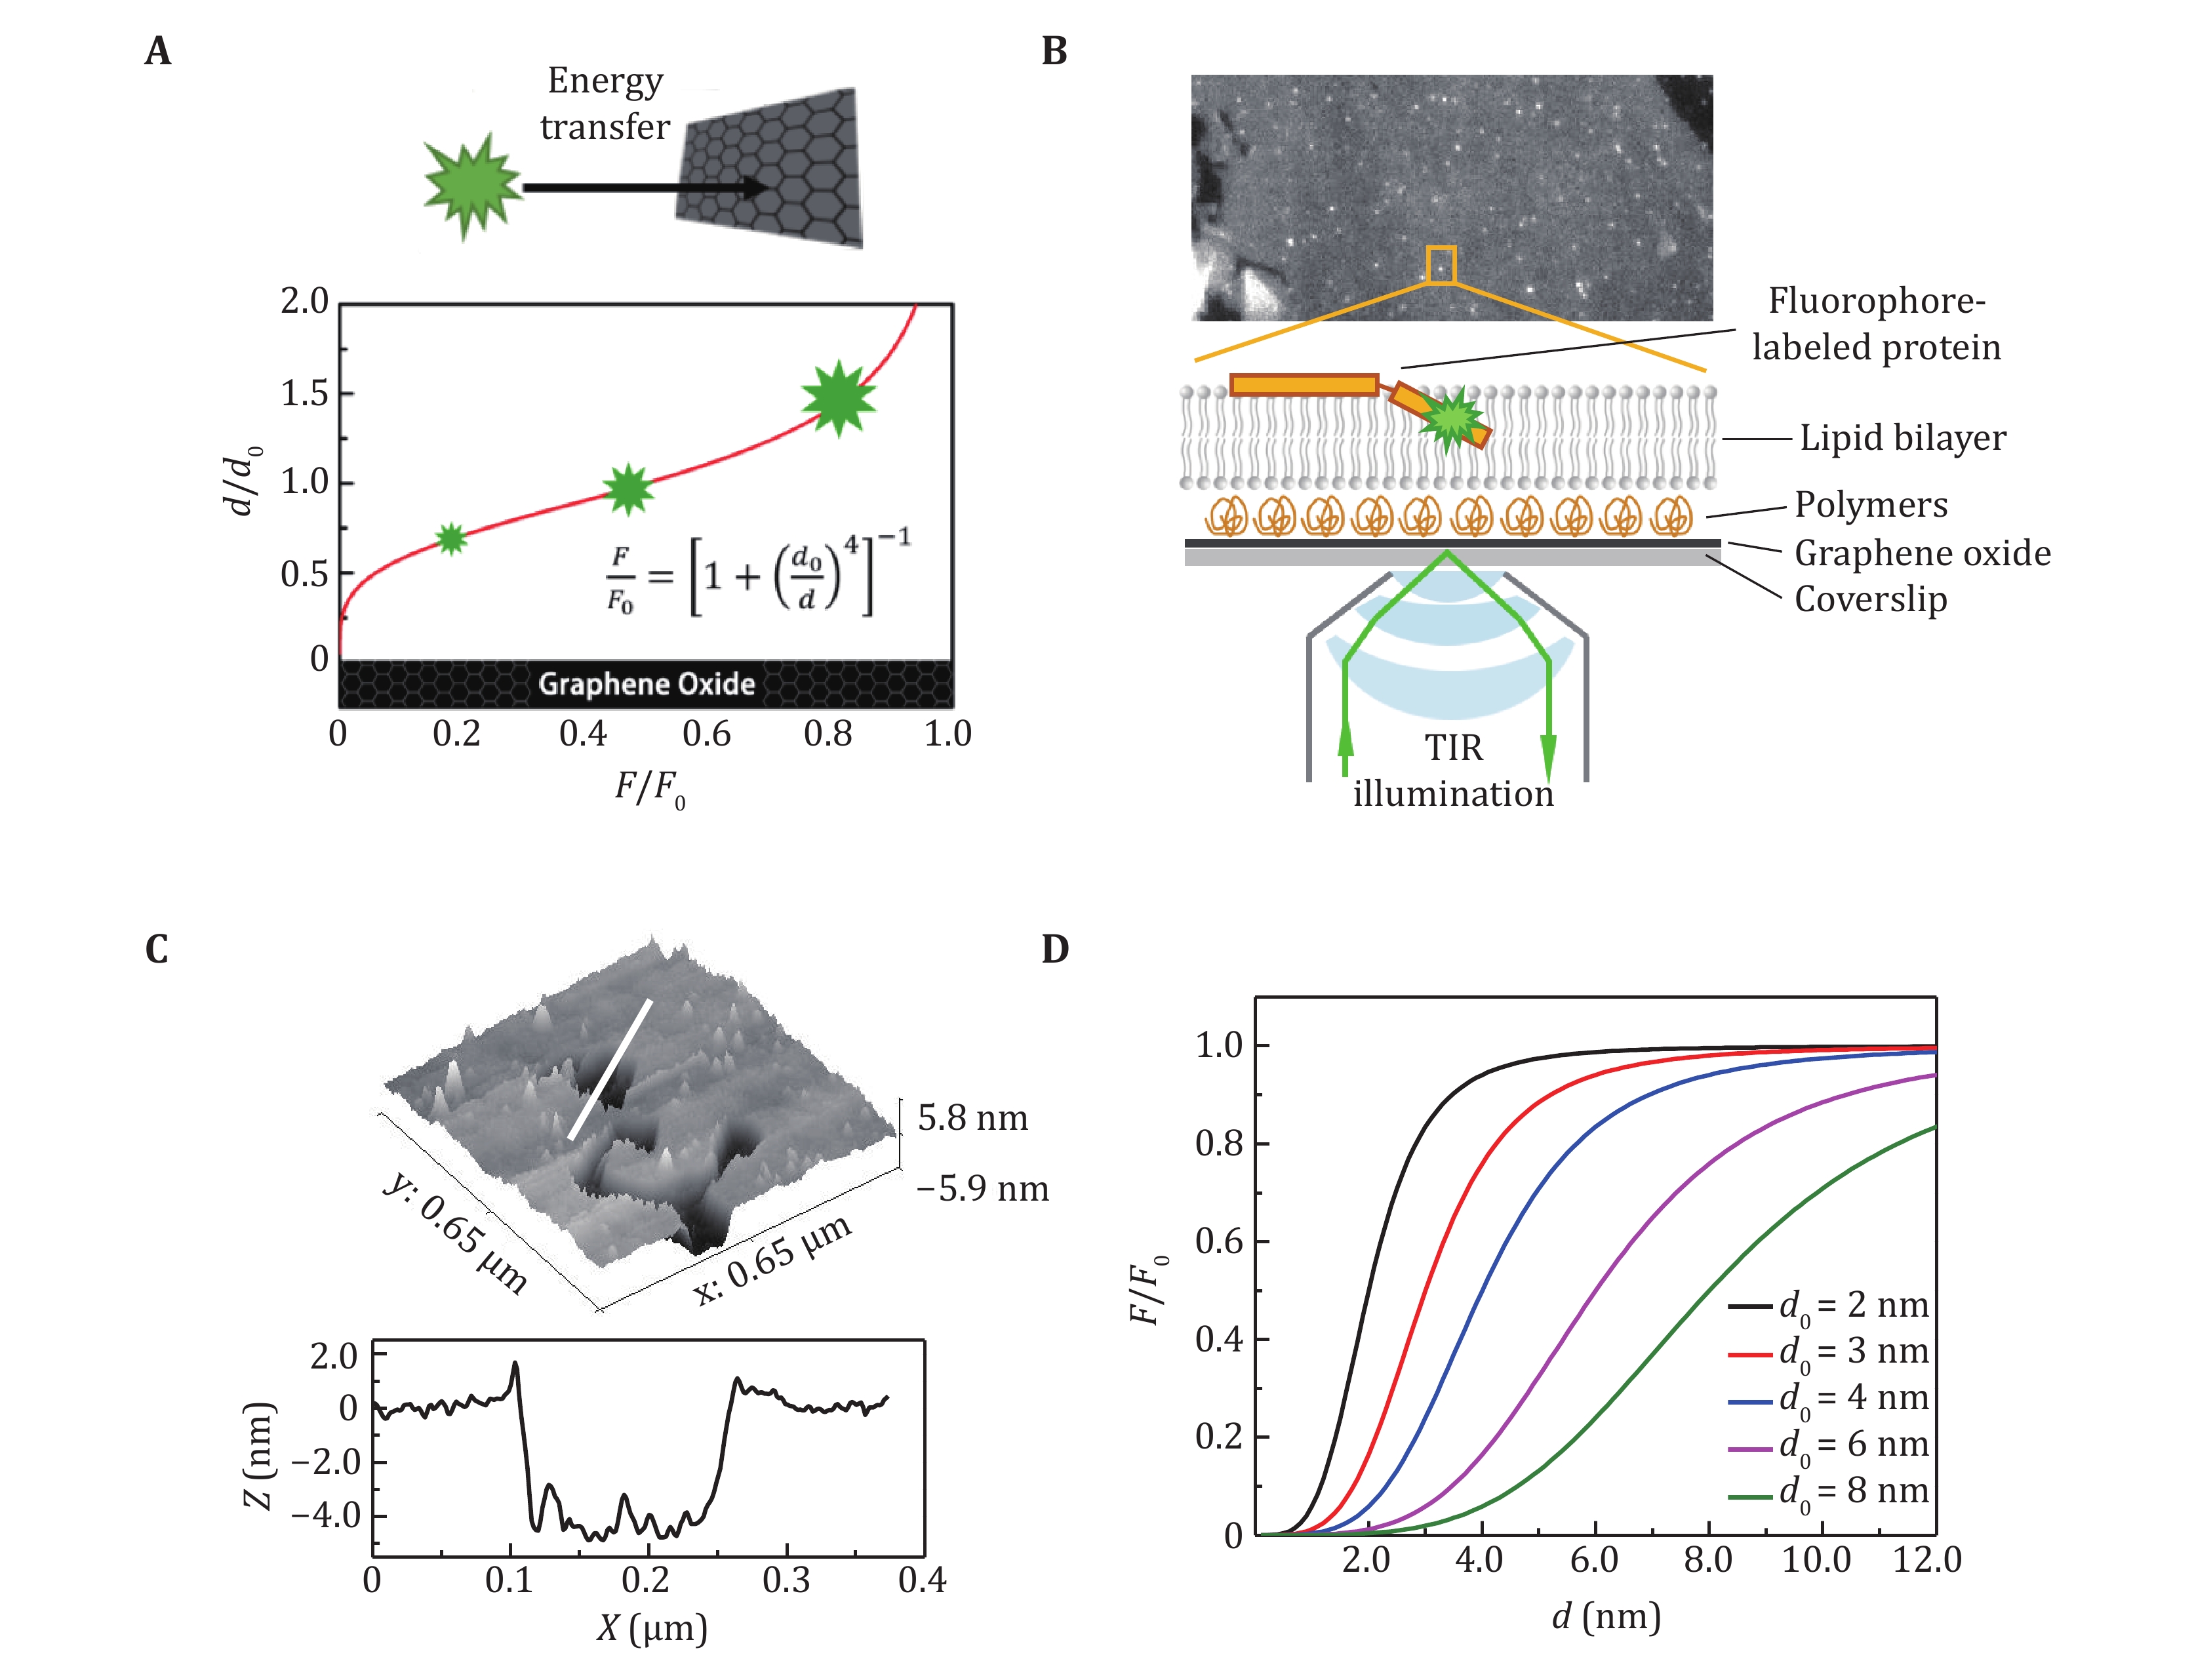
Figure 1. The principle and experimental sets of SIFA. A The fluorescence of a fluorophore changes rapidly with its distance to a graphene oxide layer. B The experimental setup of SIFA on TIRF microscopy. C The morphology (upper panel) and the profile of the thickness (lower panel) of a lipid bilayer composed of DOPC/DOPA. D The dependence of the relative intensity on distance in SIFA with different critical distances d0
-
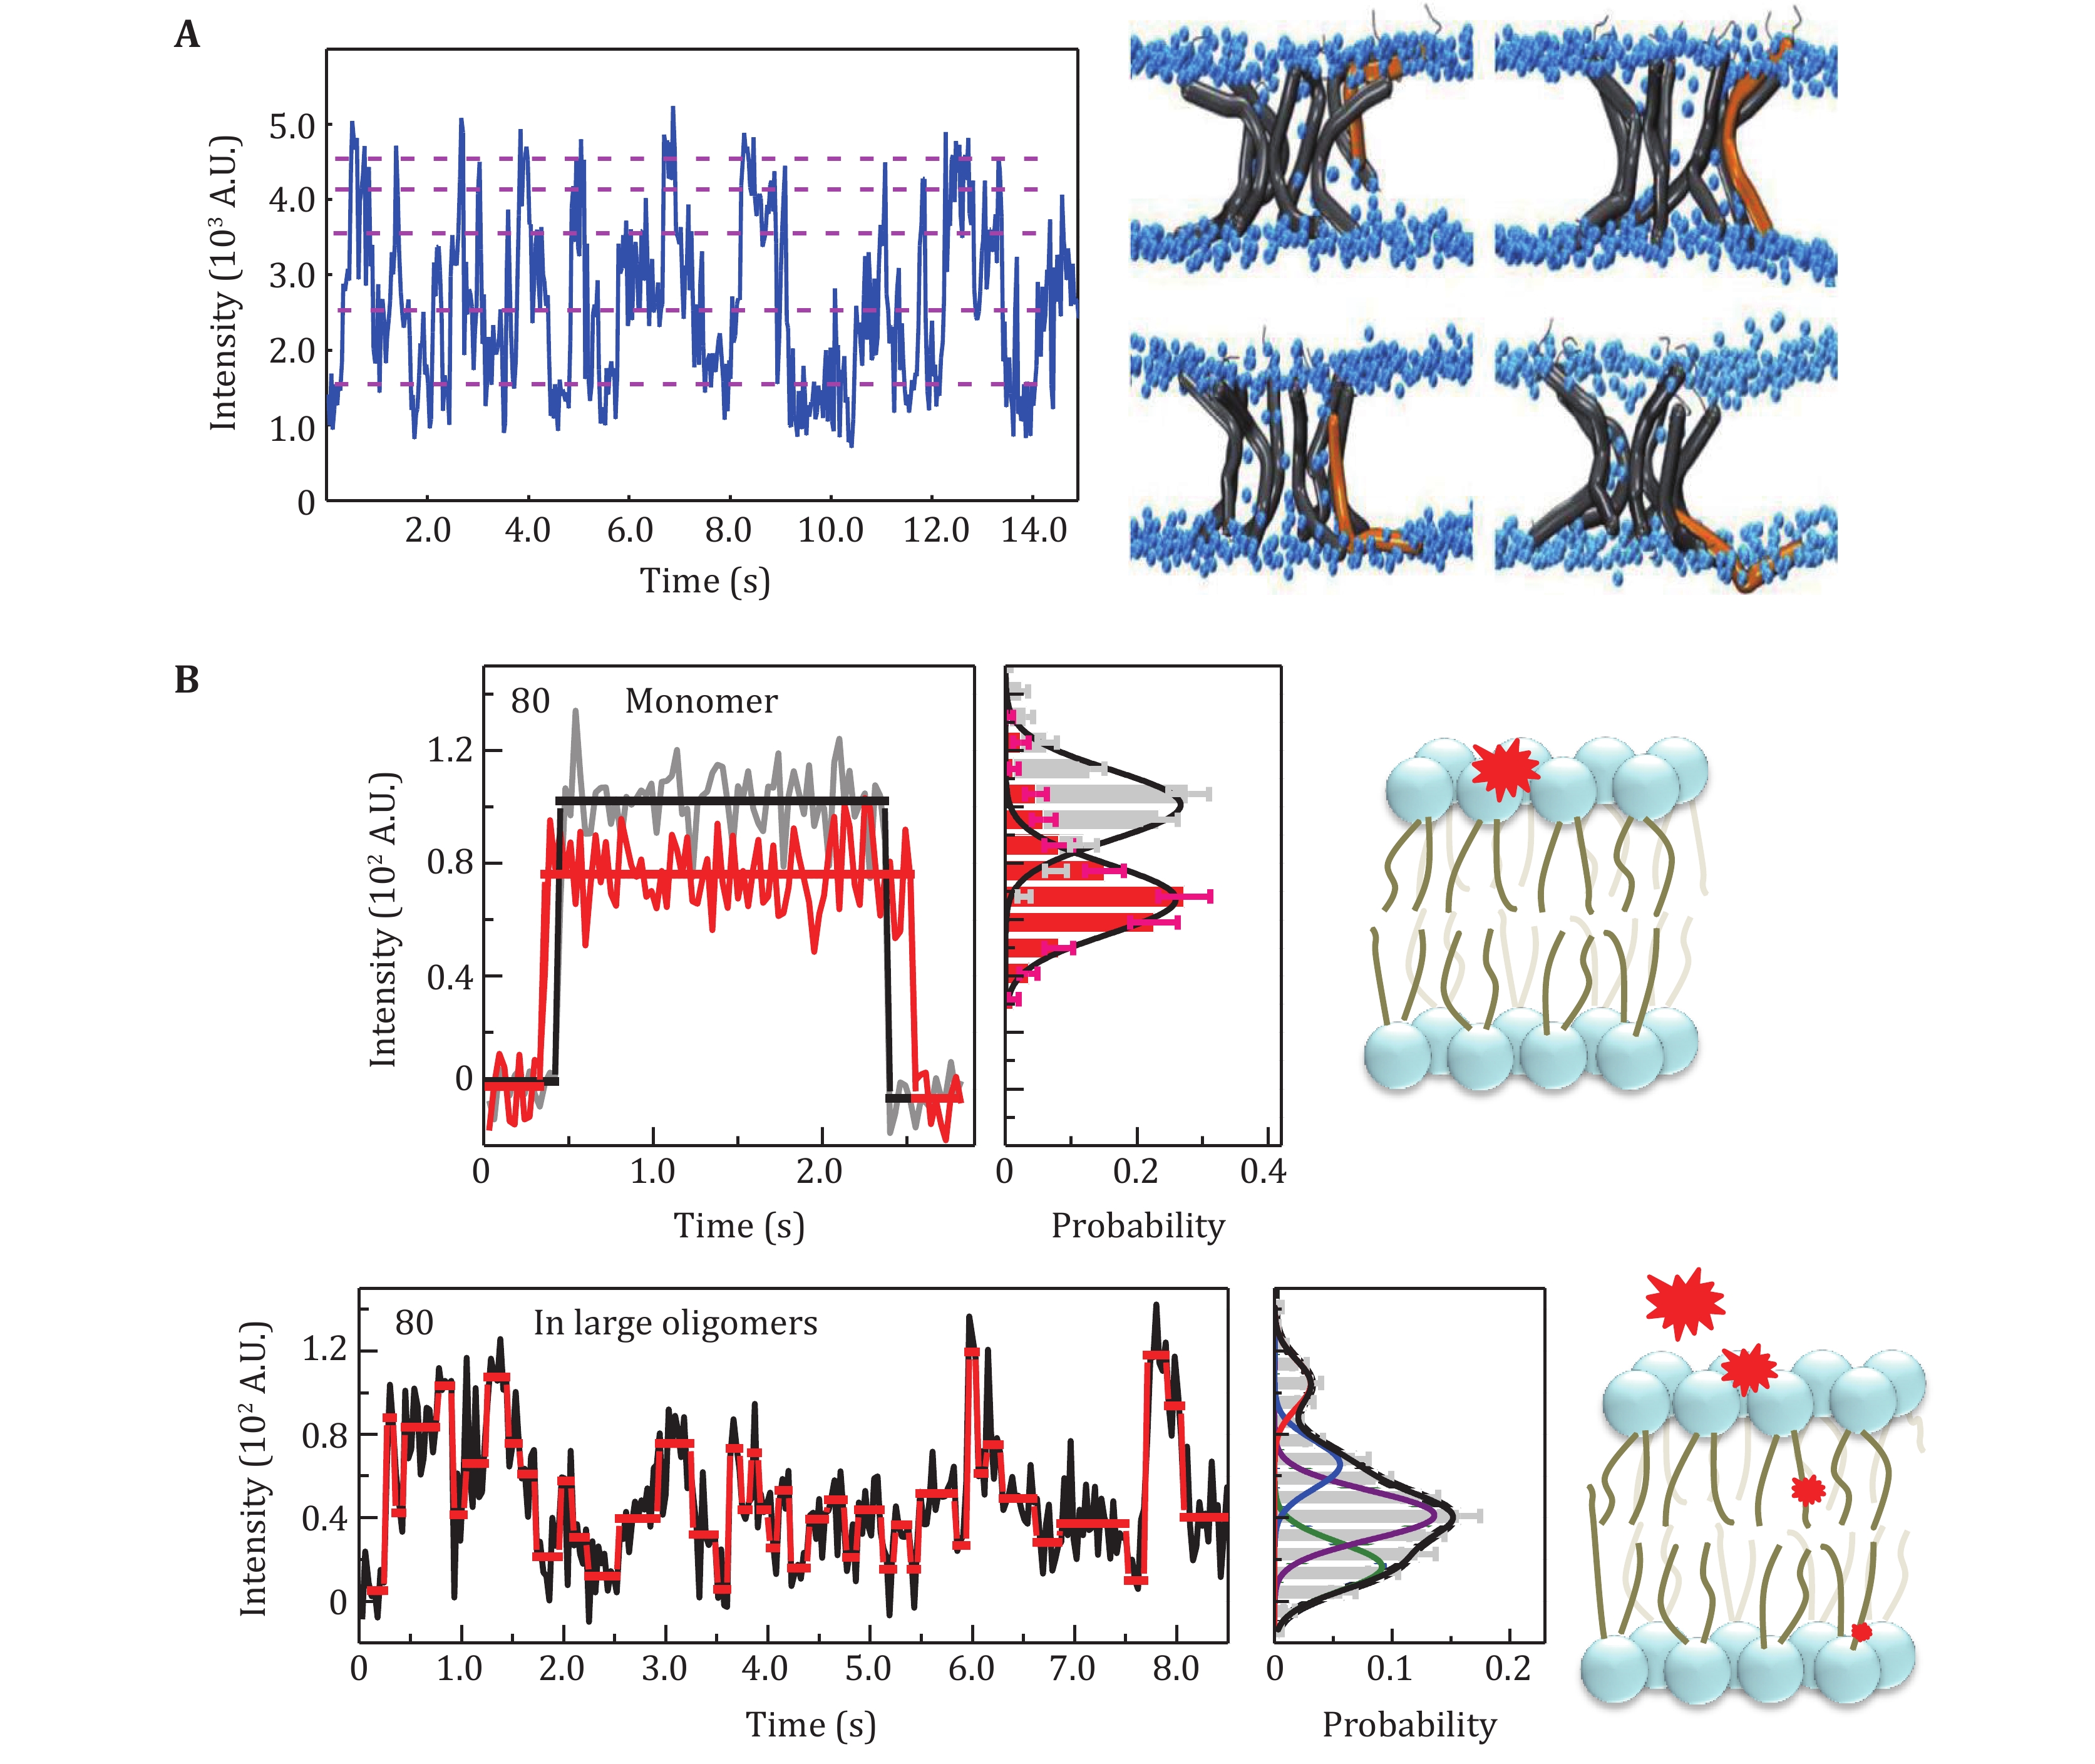
Figure 2. The applications of SIFA. A Dynamics of LL-37 N-terminal at a high peptide concentration (Li et al. 2016). The up-and-down motions are reflected by the fluorescence fluctuation in the trace (left panel), supporting the dynamic pore model (right panel). B The relatively static position of the residue 80 of a monomeric tBid (upper panel) and the upside-down movements of the same residue in large oligomers (lower panel) (Ma et al. 2019b)
-
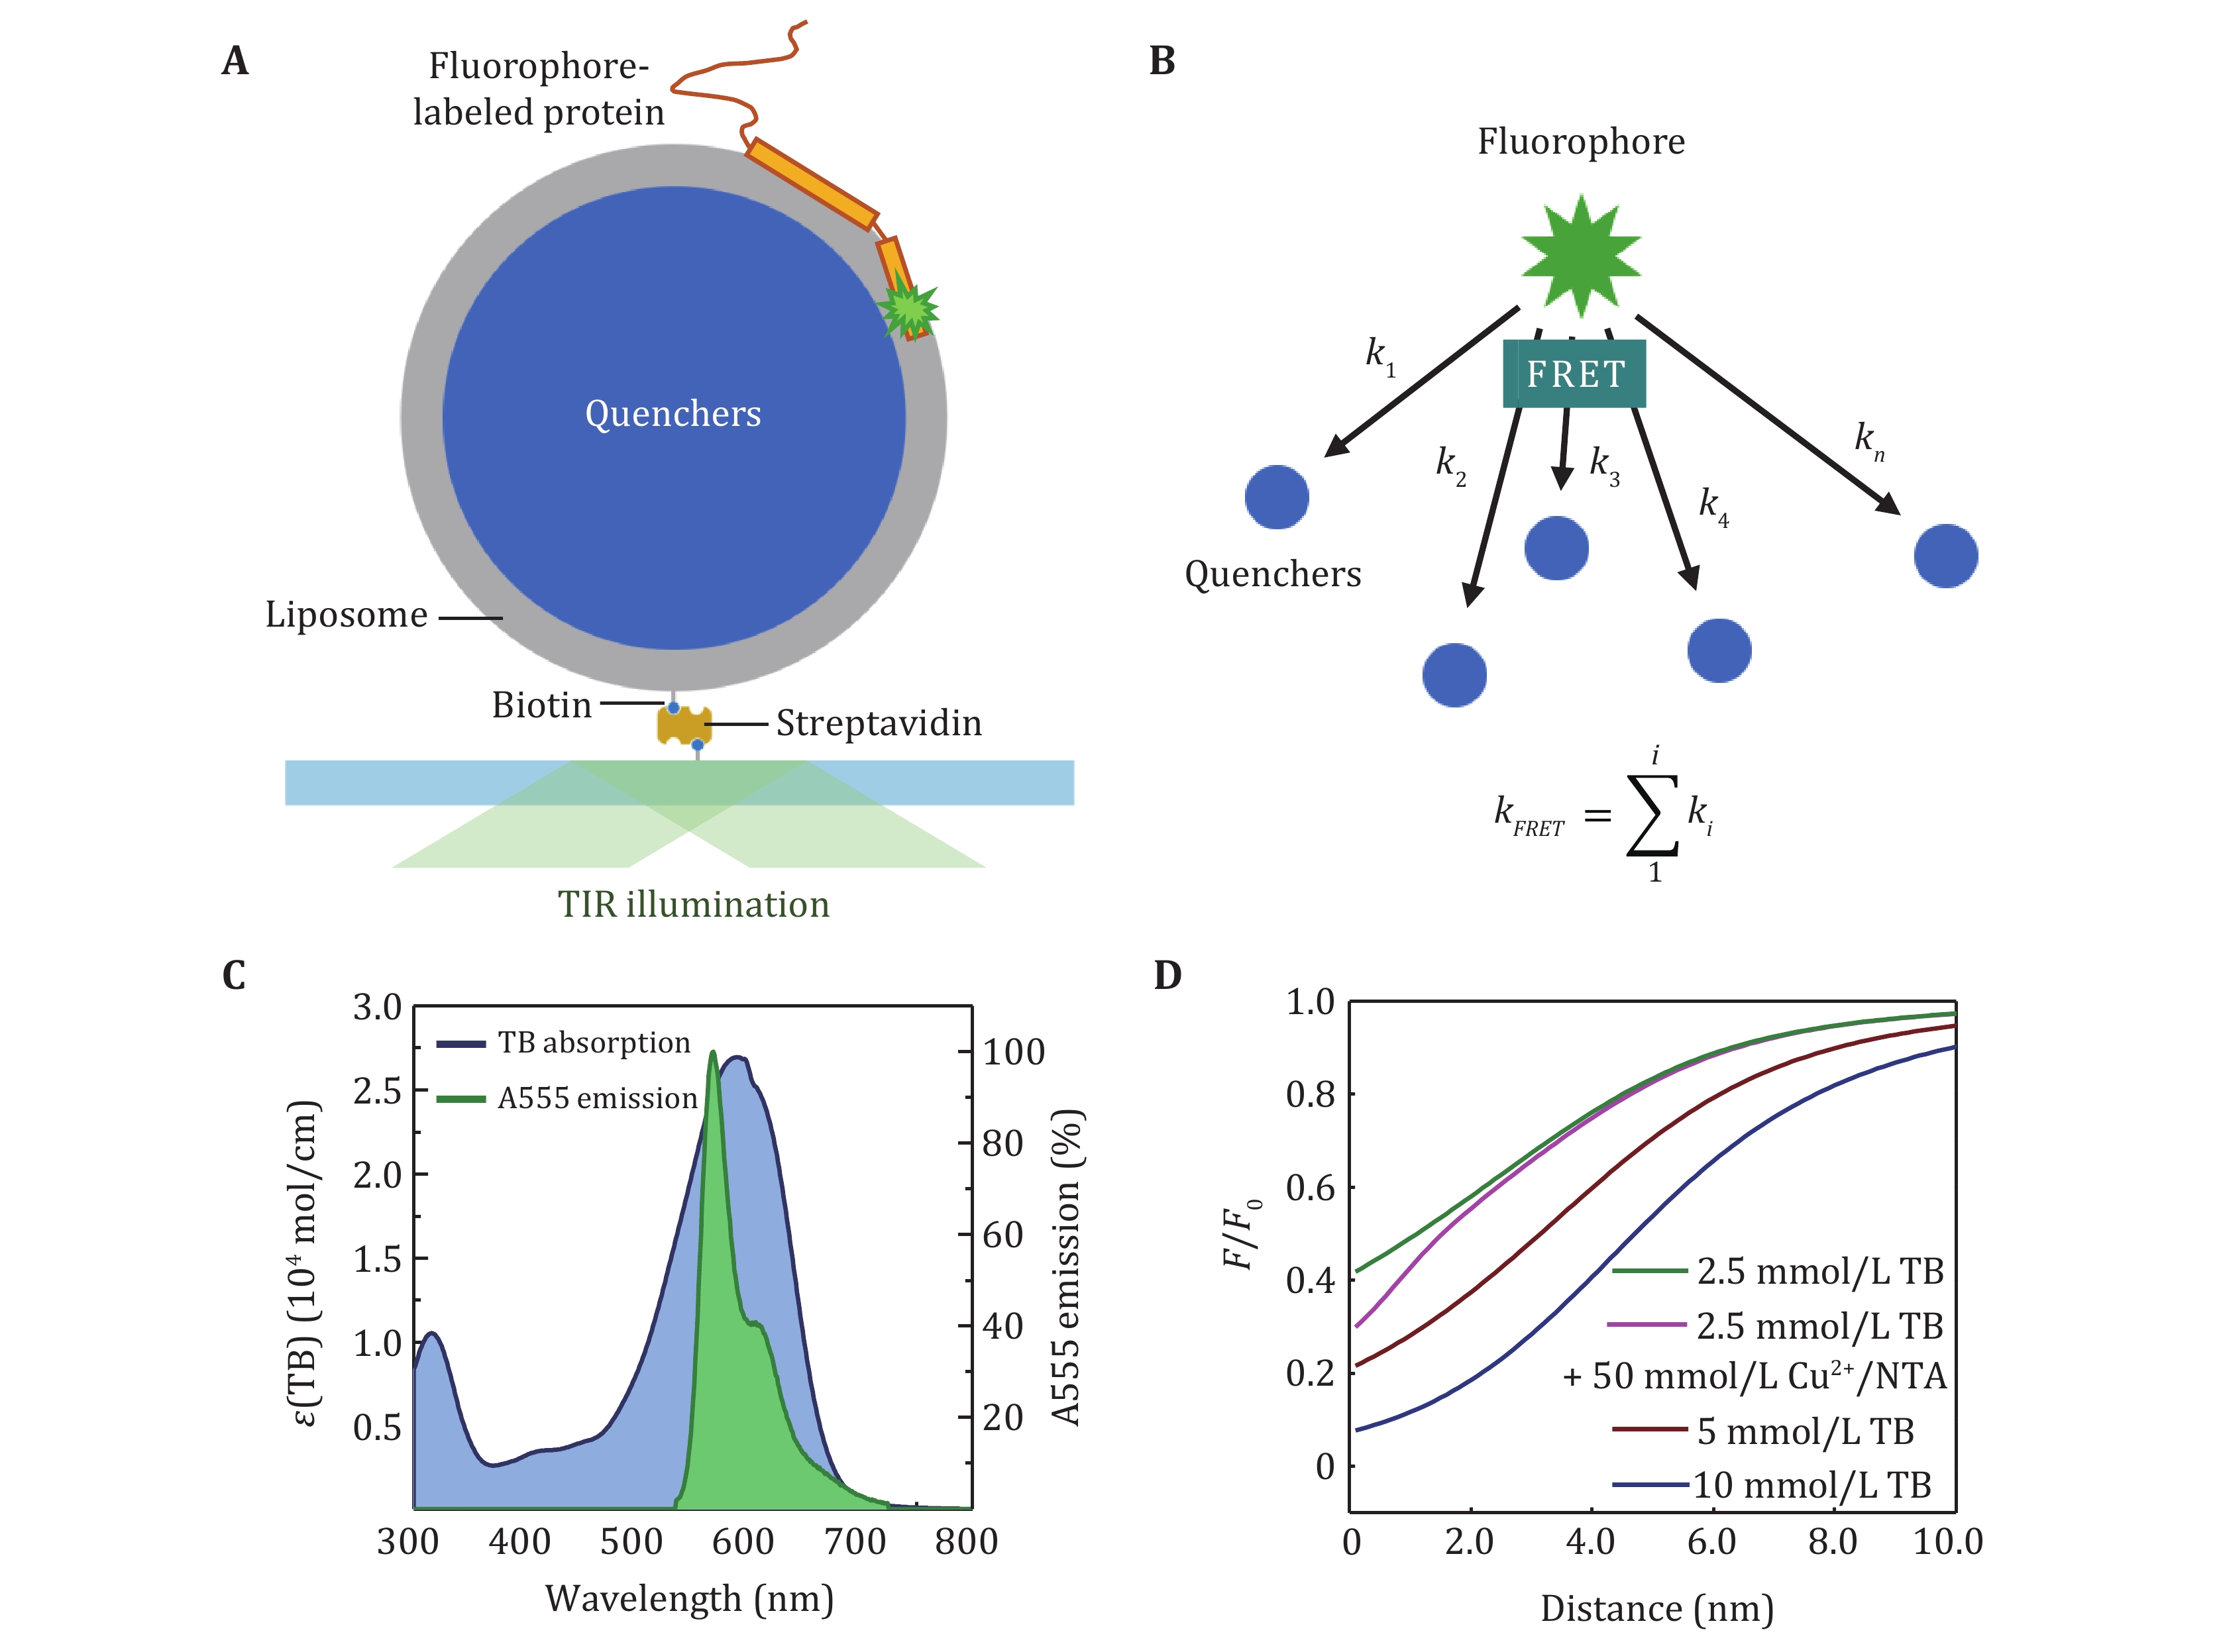
Figure 3. The principle of LipoFRET. A The scheme of LipoFRET. B FRET from one donor to multiple acceptors. C The absorption spectra of TB (blue) and the emission spectra of the donor Alexa Fluor 555 (green). D The dependence of the relative intensity on the distance to the inner surface of the liposome membrane in LipoFRET
-
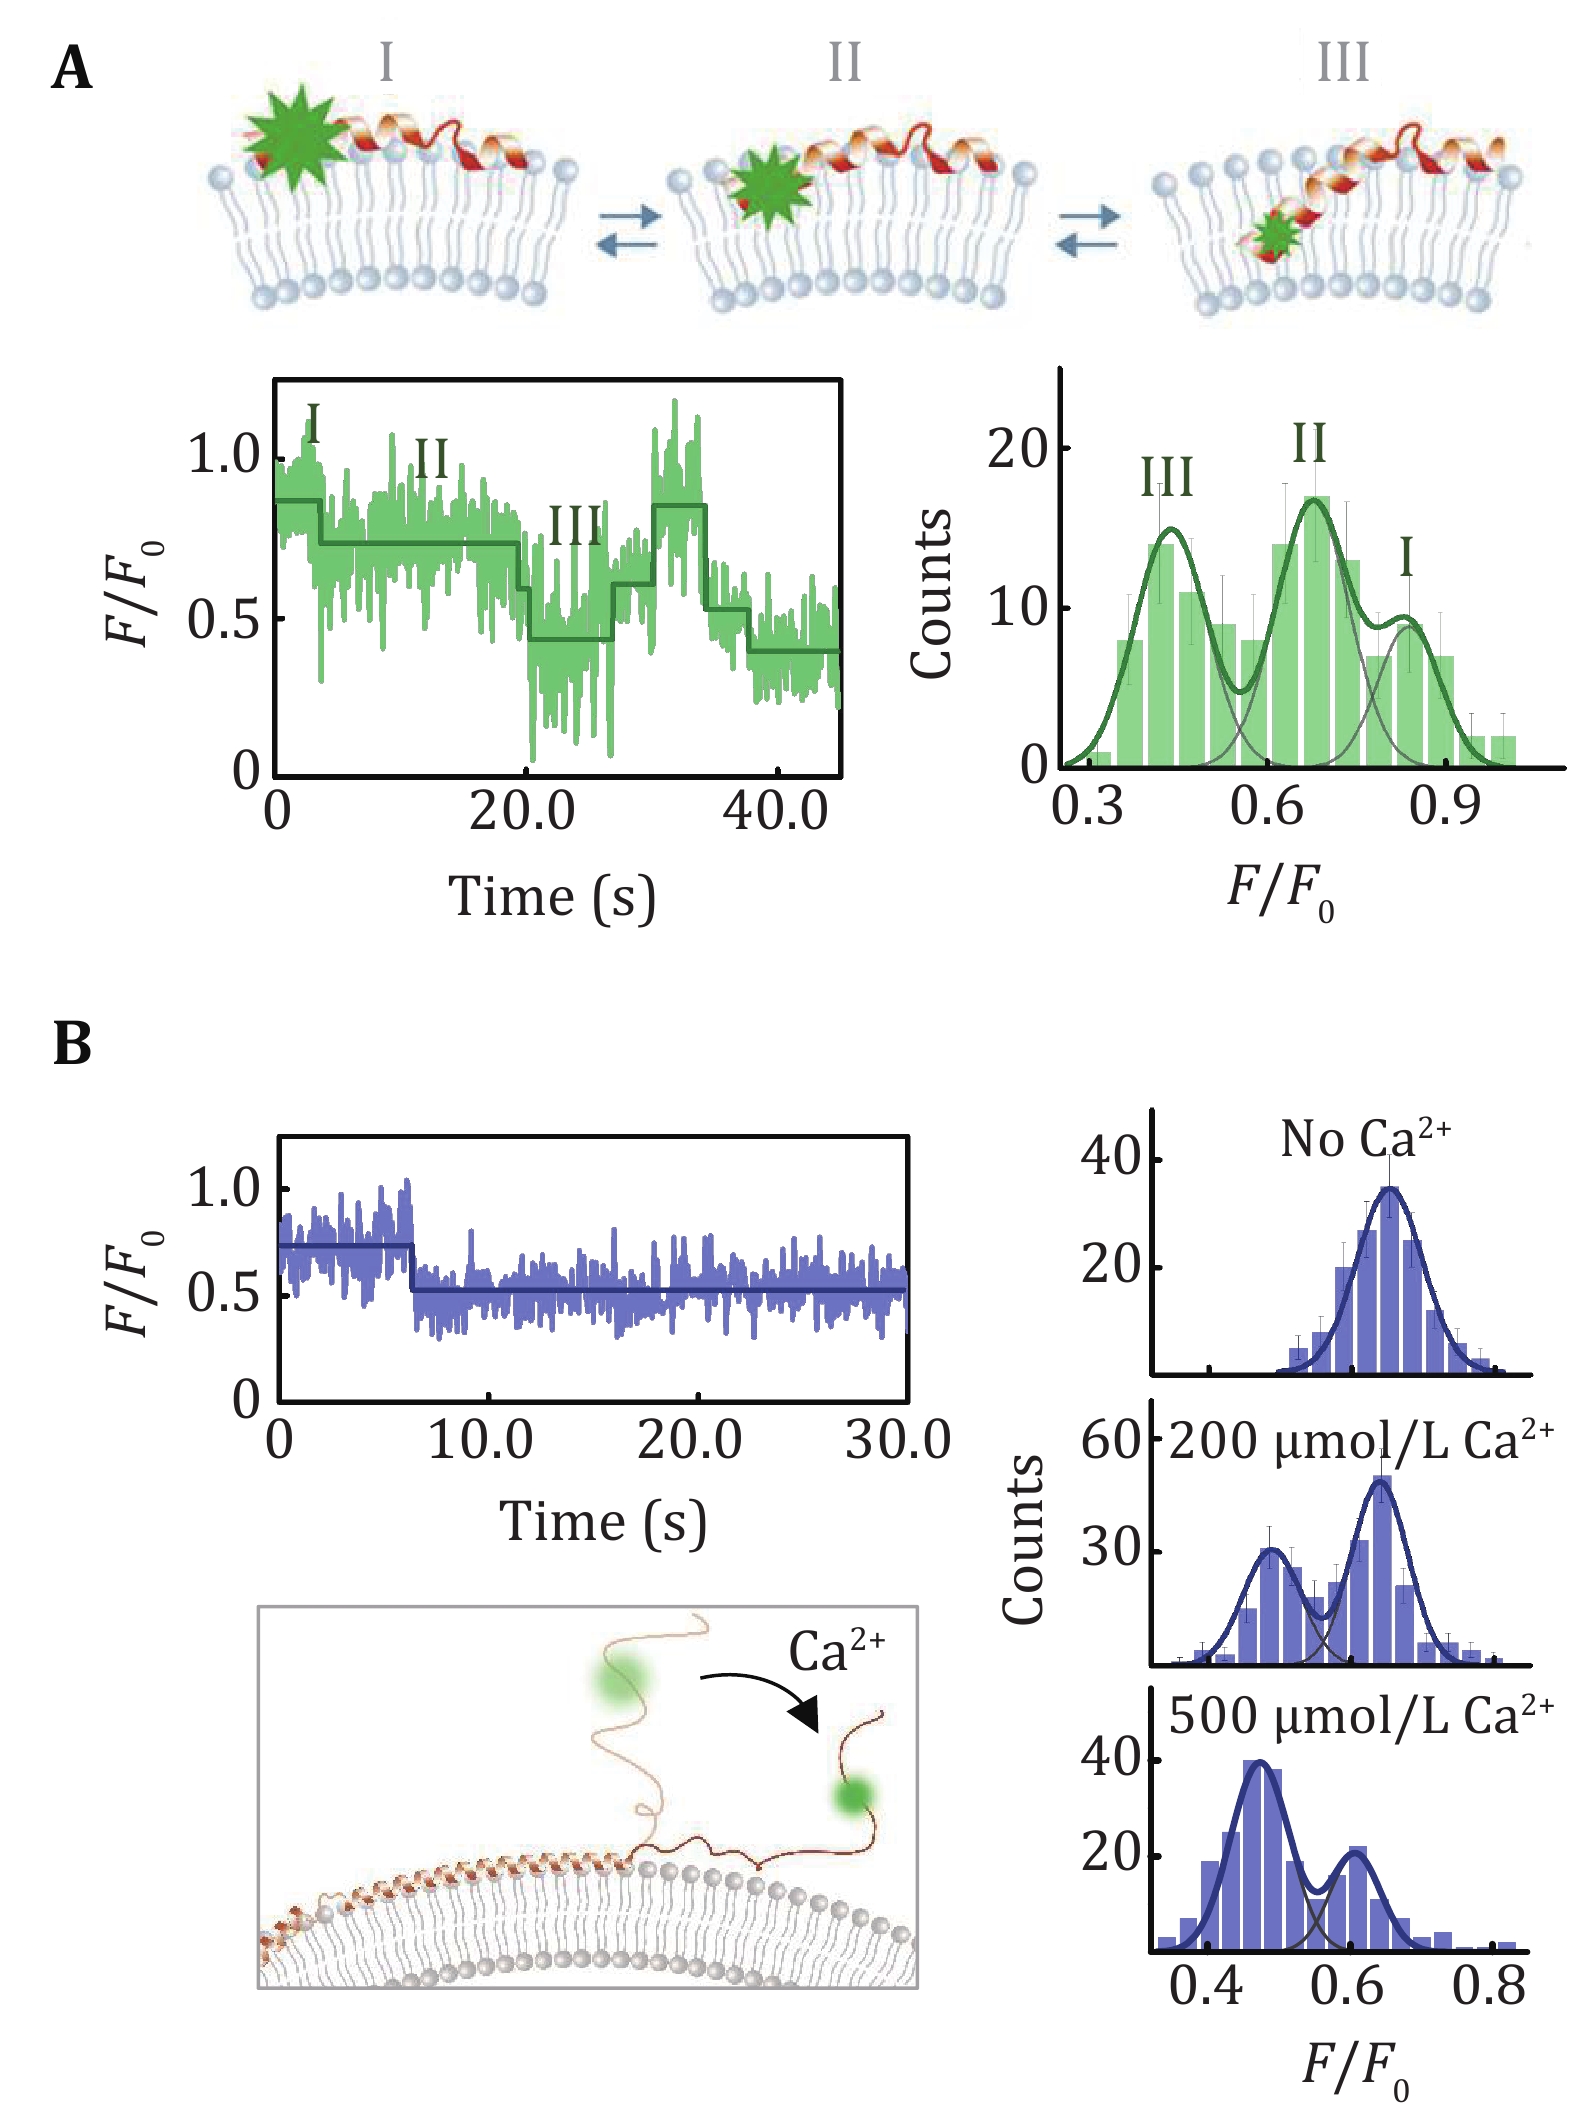
Figure 4. LipoFRET analysis of α-synuclein on the liposome membrane. A The spontaneous position changes of the N-terminal of α-synuclein (upper panel) and the corresponding intensity trace and distribution (lower panel) (Ma et al. 2019a). B Calcium-induced position changes of the acidic tail of α-synuclein (Ma et al. 2019a). The trace indicates the position changes of the C-terminal in the presence of Ca2+. The histograms showed the intensity distribution of the Alexa Fluor 555 labeled on residue 129 in the absence of Ca2+and in the presence of 200 μmol/L and 500 μmol/L Ca2+
-
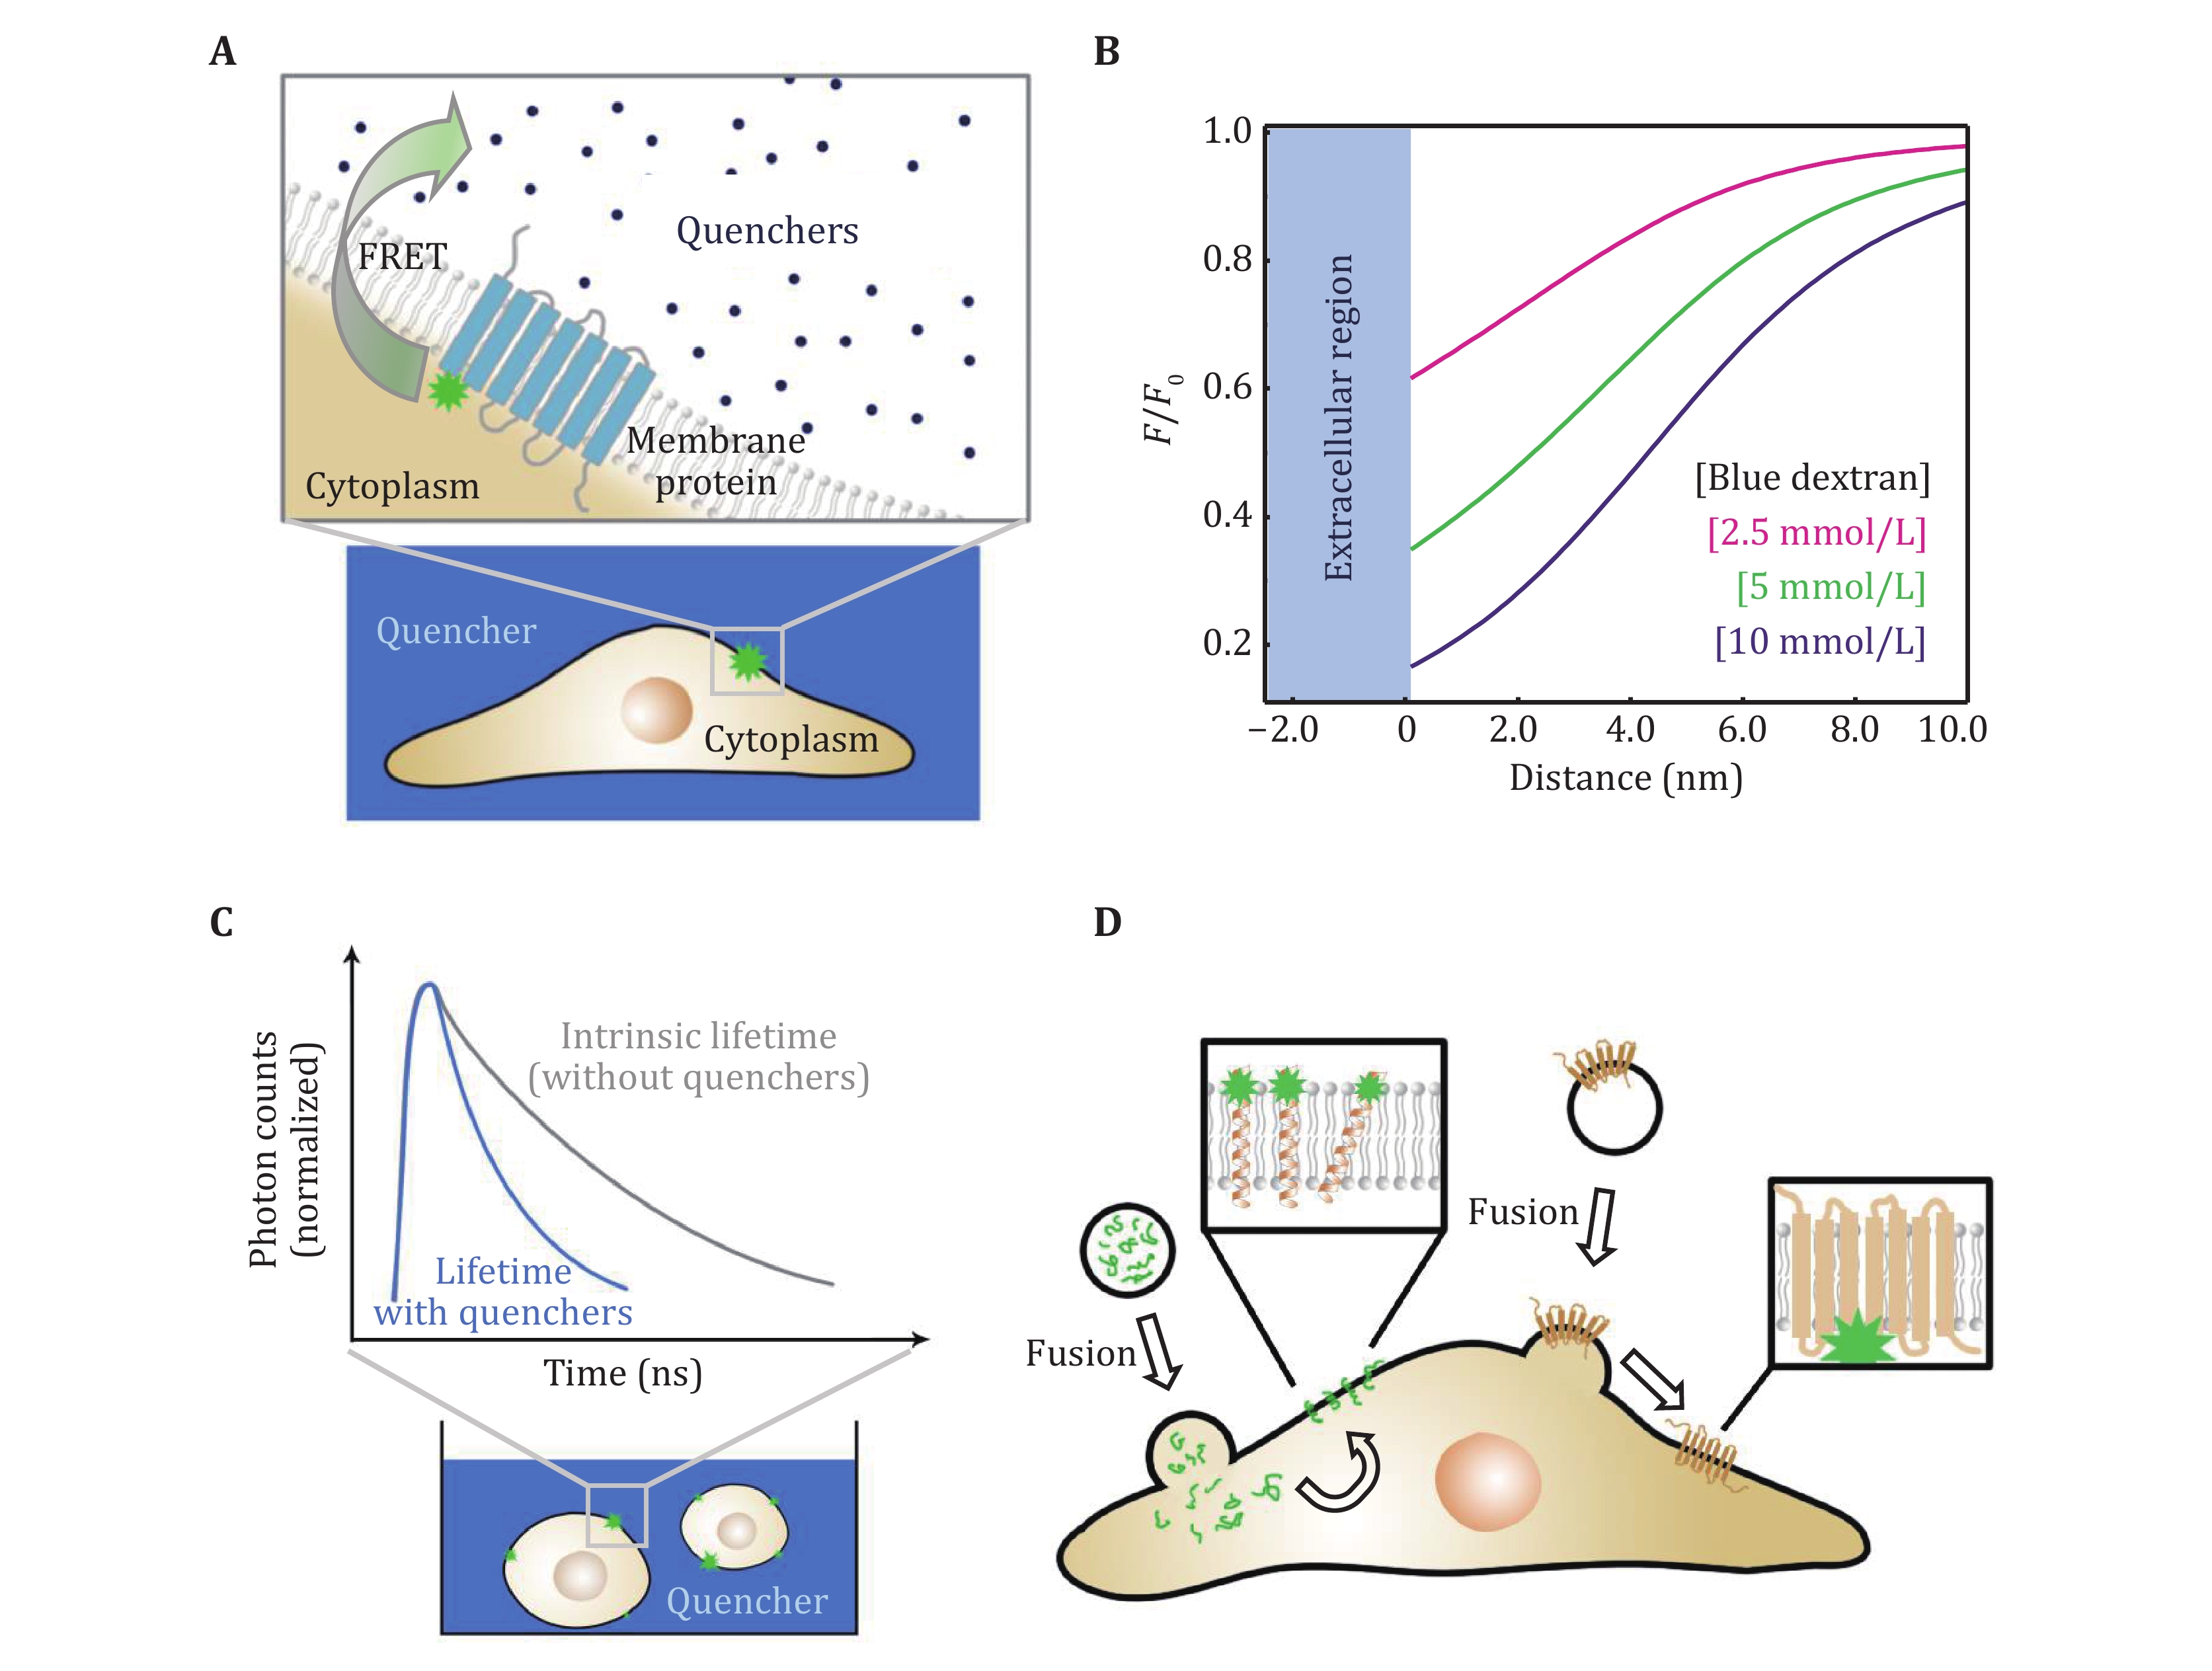
Figure 5. The principle and data acquisition of QueenFRET. A QueenFRET on live cell membranes. B Dependence of the relative intensity on the distance (in the direction inward the cell) to the outer surface of the cell membrane. C The scheme of the fluorescence lifetime measurements on live cells. The donors undergoing FRET have shortened fluorescence lifetimes (upper panel). D The incorporation of fluorophore-labeled peptides and proteins onto live-cell membranes
-
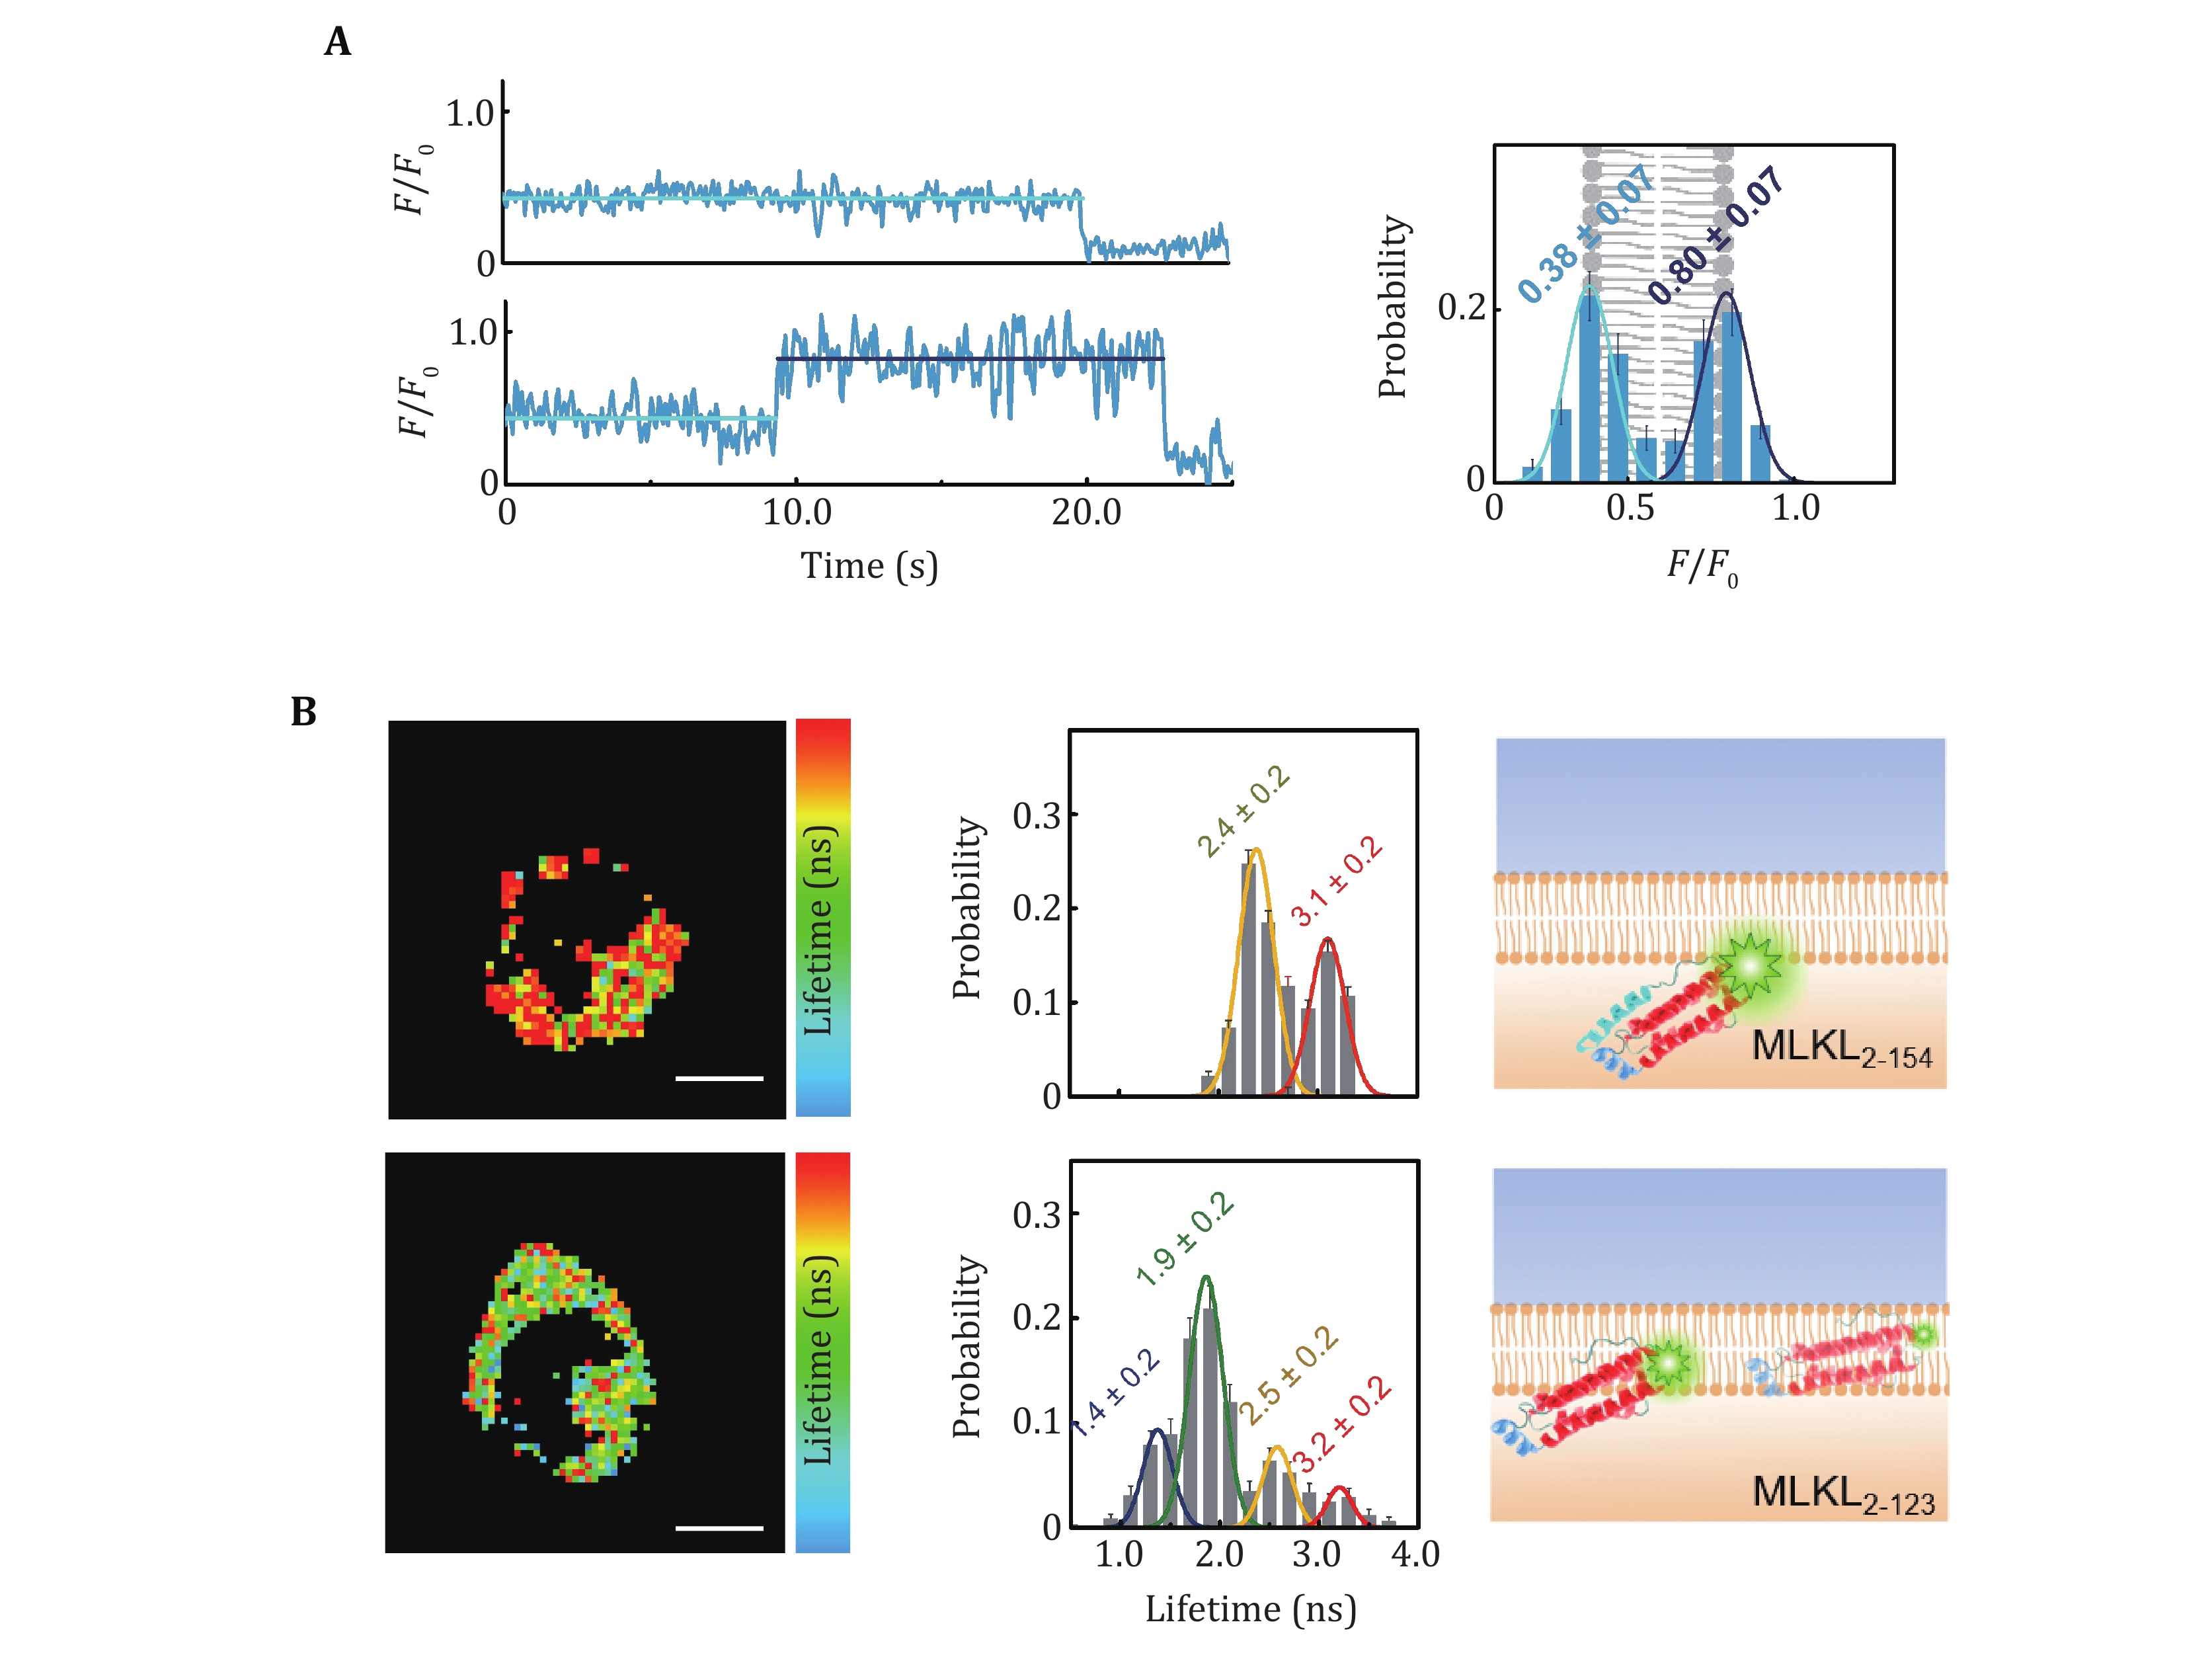
Figure 6. QueenFRET assay of interactions of biomolecules with live-cell plasma membranes. A QueenFRET measurement of flip-flops of lipid molecules on the cell membrane (Hou et al. 2021). The traces in the left panel show a lipid molecule whose headgroup points to the outer leaflet of the cell membrane (upper) and a lipid molecule that flips from the outer leaflet to the inner leaflet (lower). The histogram showed the intensity (position) distribution of the TAMRA-labeled lipids. B The locations of MLKL2-154 and MLKL2-123 in live cell membranes (Hou et al. 2021). The lifetime images (left panel) and the distributions (middle panel) clearly indicate the different in-membrane positions of MLKL2-154 and MLKL2-123
Figure
6 ,Table
0 个