-
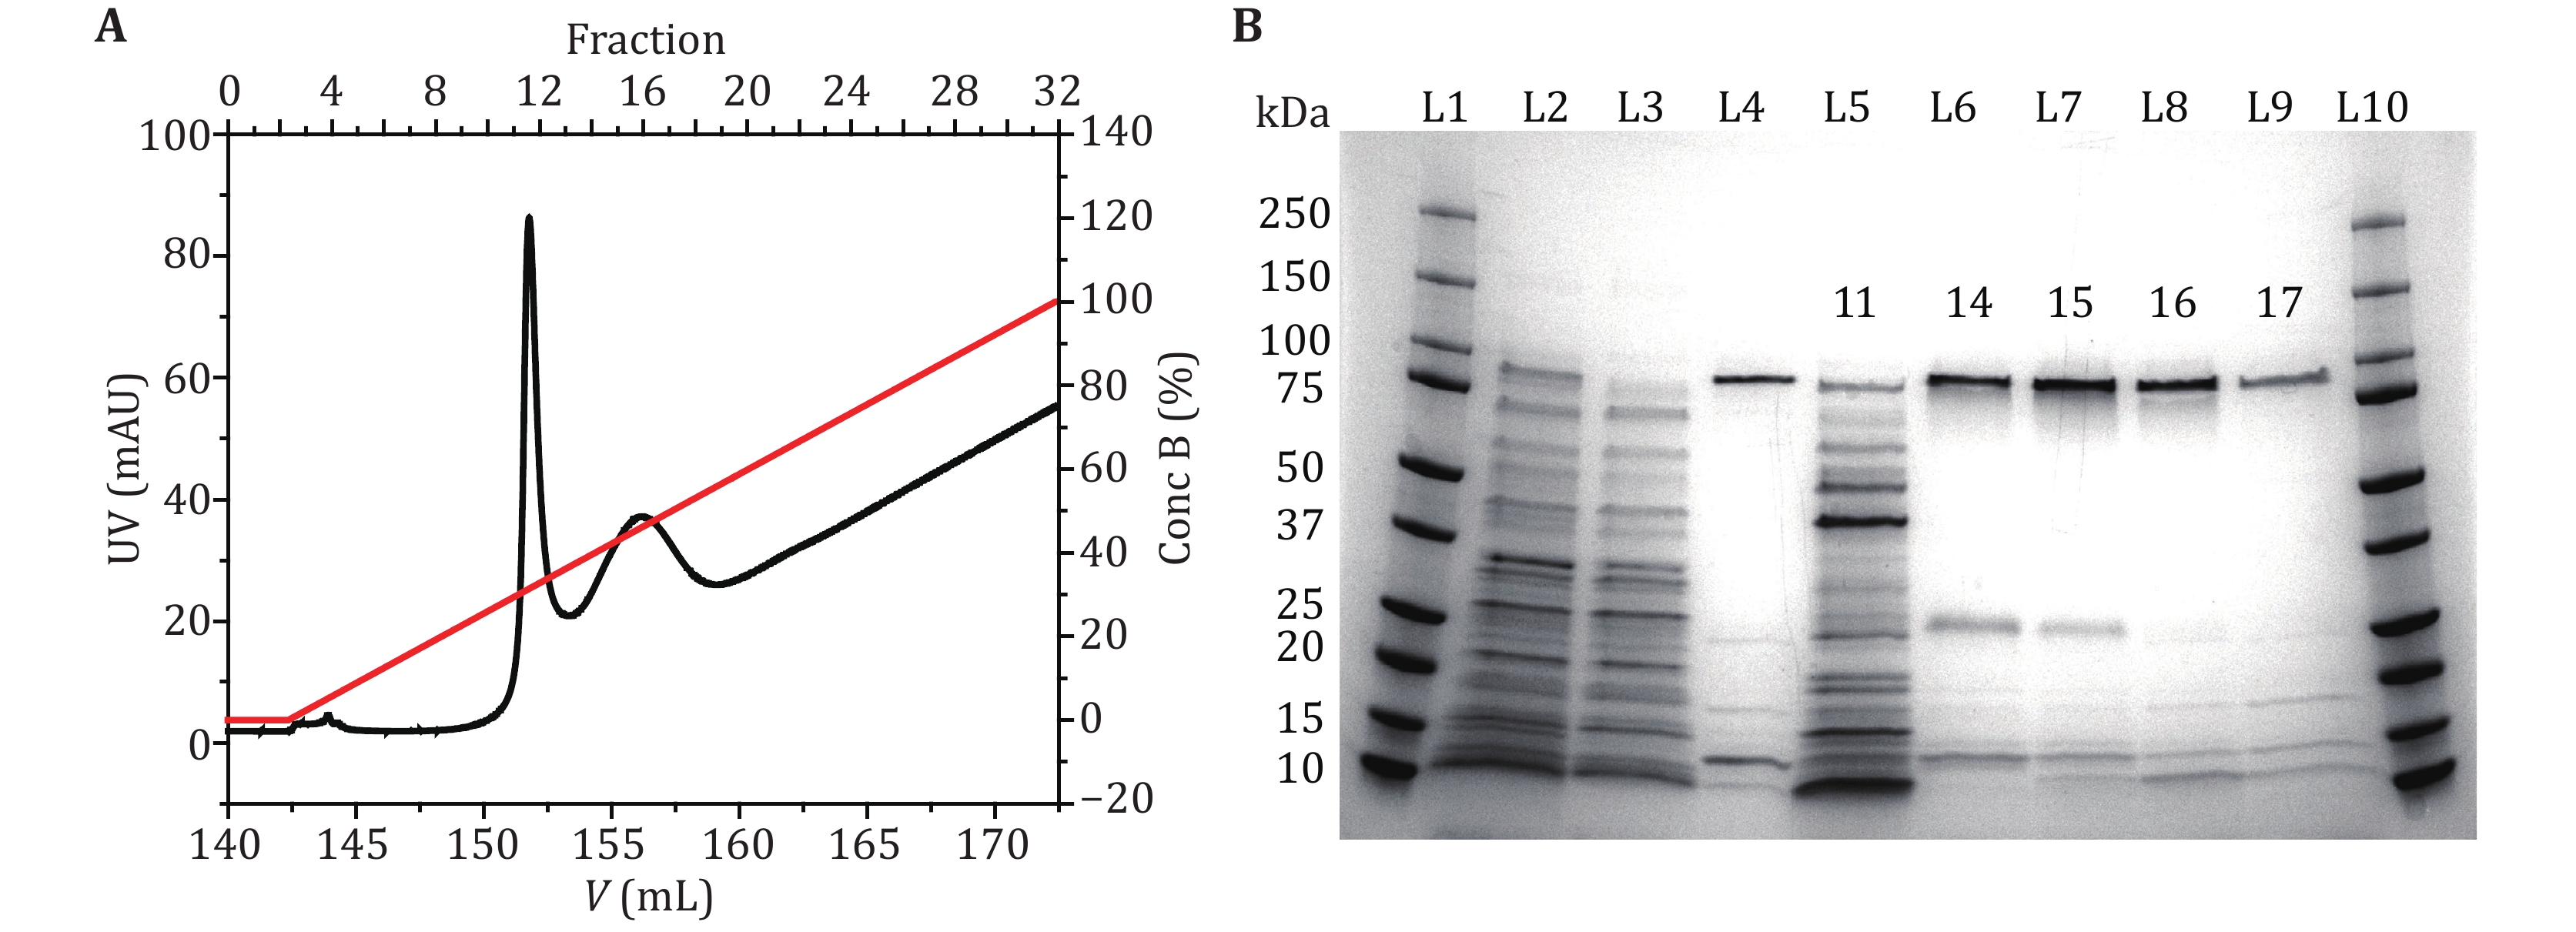
Figure 1. MspA purification and characterization. A The UV absorbance spectrum during the gradient elution of Ni-affinity chromatography. Two major peaks around the 11th and the 16th fractions were observed in the spectrum. Their identities were confirmed by gel electrophoresis. B MspA octamer characterized using SDS-polyacrylamide gel electrophoresis (4%–20% gradient gel). L1 and L10: precision plus protein standards (Bio-Rad). L2: the supernatant of the bacterial lysate. L3: the eluent of the bacterial lysate after column loading. L4: standard MspA sample. L5–L9: the eluted fractions in A. The index of the fraction was respectively marked on the gel. The gel results show that the first peak (fraction 11) corresponds to the eluent containing non-desired proteins. The second peak (fraction 14–17) corresponds to the eluent containing the desired MspA octamer. The impurity bands in lanes L6–L9 are some proteins of E. coli itself, which have non-specific adsorption with Ni-column
-
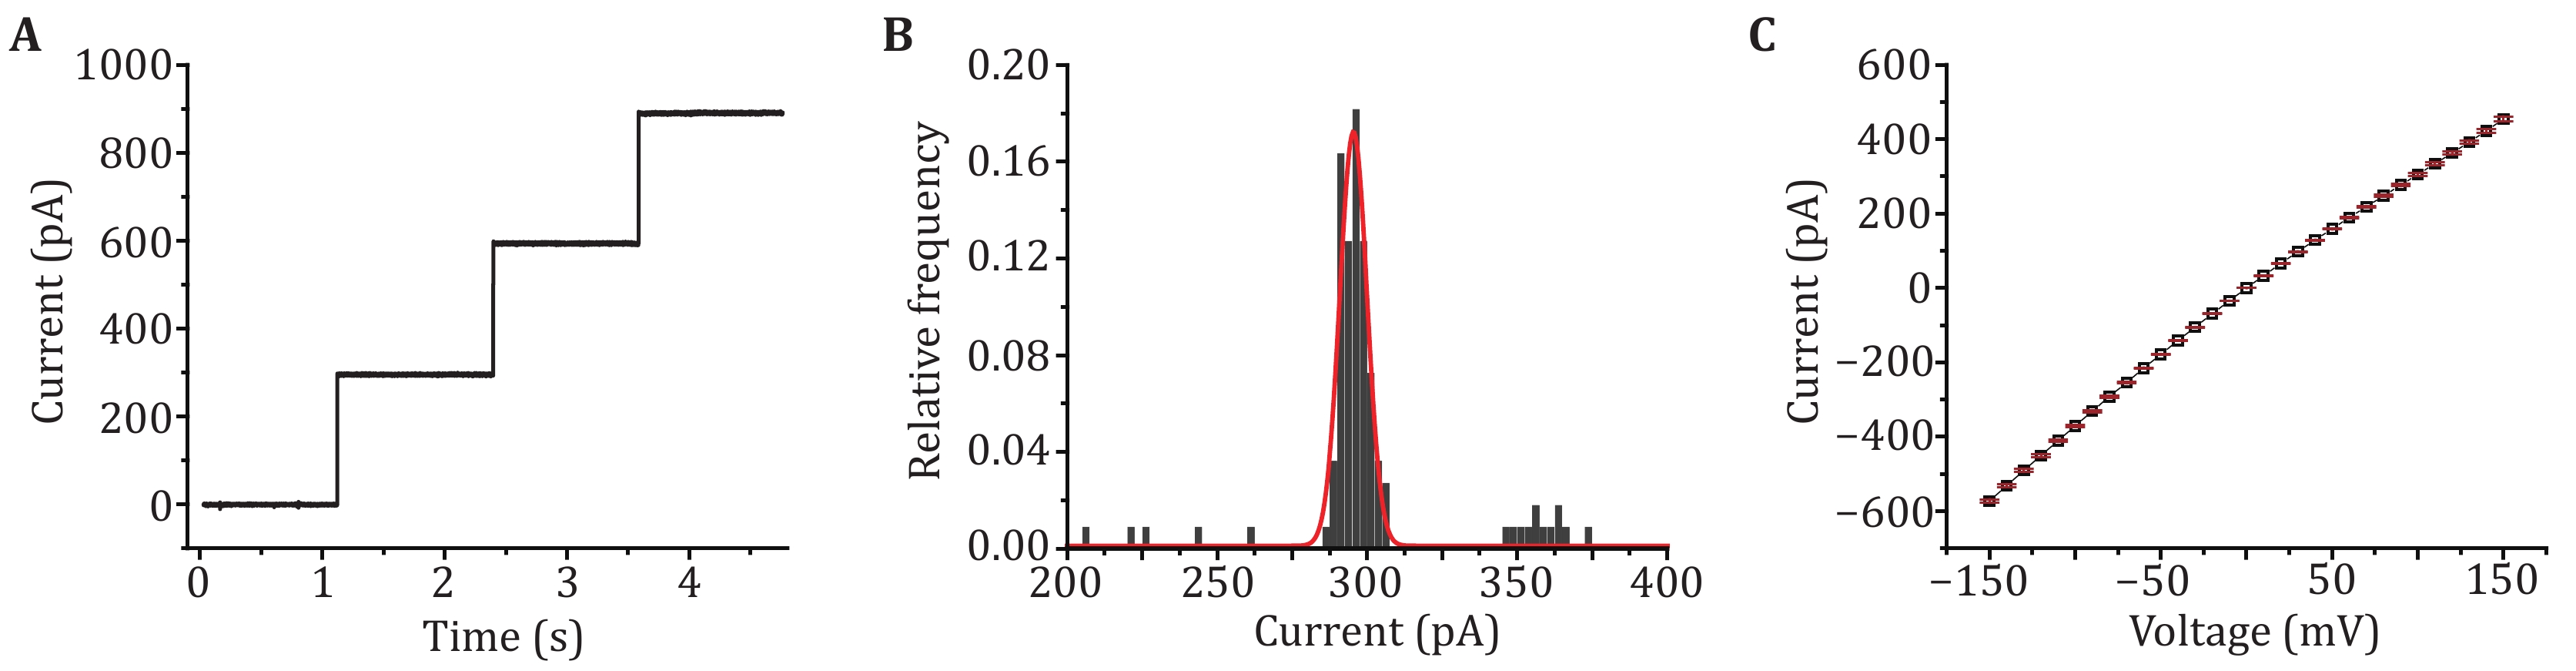
Figure 2. Single channel recording with MspA. A Successive channel insertions of MspA. A +100 mV voltage was continuously applied. Successive channel insertions would spontaneously happen, indicating that MspA obtained by this method show a high pore forming activity. B The histogram of open pore currents of MspA. A +100 mV voltage was applied during the measurement. The statistics were based on 50 nanopores (N = 100). C I–V curve of MspA. The statistics were based on 3 nanopores (N = 3). The mean values were shown with black squares and the error bars were shown with red lines. All measurements were performed in a 1.5 mol/L KCl buffer. MspA was added to cis to trigger the spontaneous pore insertion
-
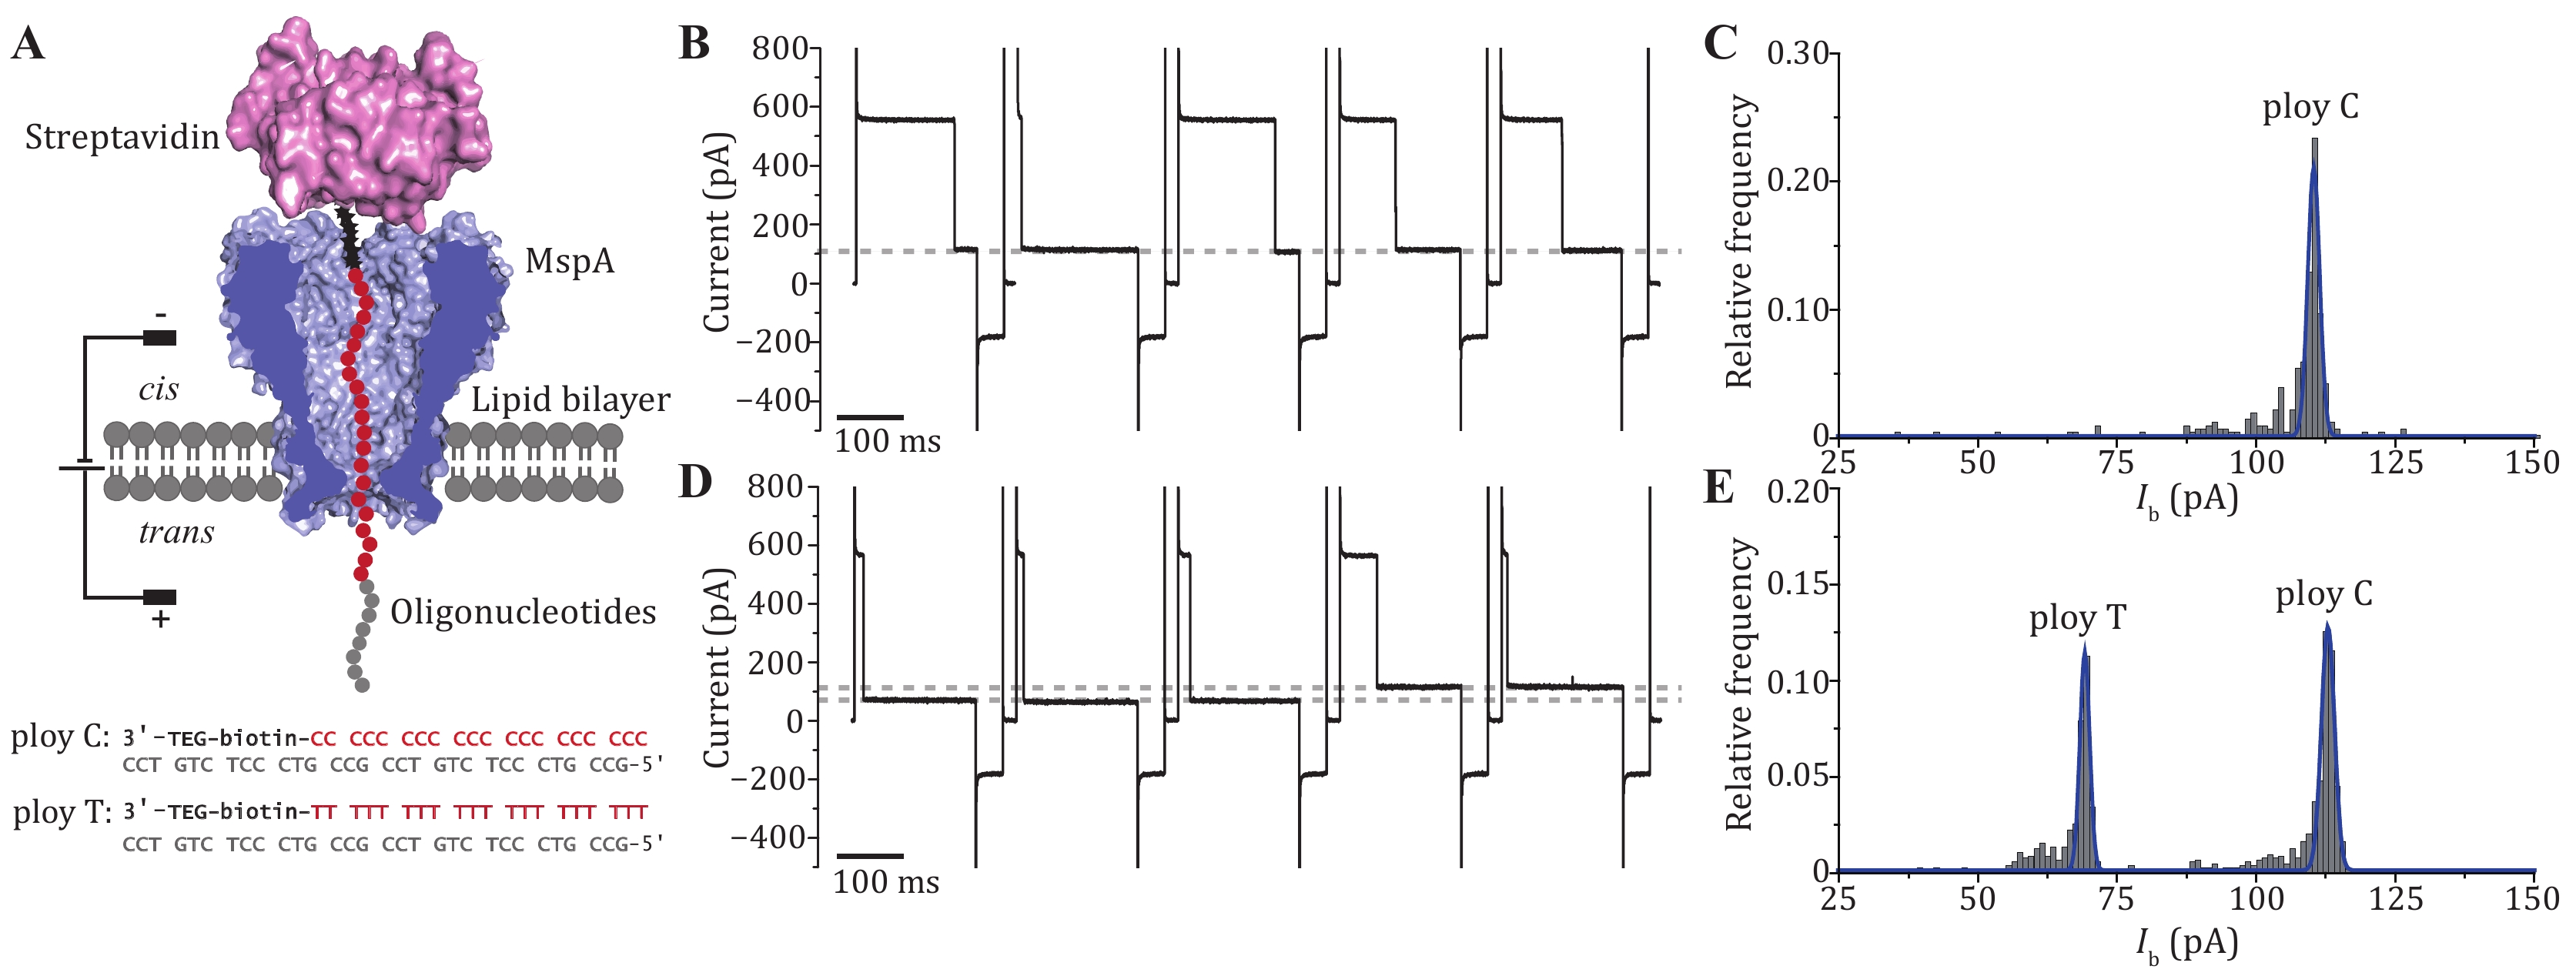
Figure 3. The DNA immobilization assay performed with MspA. A The schematic diagram of the measurement (top) and the sequence of the ssDNA oligonucleotides applied (bottom). Both oligonucleotides contain a 3’ biotin that can be tethered with a streptavidin stopper. During the measurement, the streptavidin-ssDNA complex can be electrophoretically captured by the pore and a residual current is reported. B Successive blockade events caused by the poly C-streptavidin complex. The blockade current level is indicated with the grey dotted line. C Histogram of the corresponding blockade current as demonstrated in B. Only a single peak is observed from the histogram. D Successive blockade events caused by the poly C-streptavidin complex and the poly T-streptavidin complex. The measurement was performed by subsequent addition of poly T-streptavidin complex to the measurement as described in B. Two blockade current levels were observed with highly distinguishable current levels. Both blockage levels are marked with grey dashed lines. E Histogram of corresponding blockade current as demonstrated in D. Two distinct peaks are observed respectively corresponding to nanopore reading of ploy C or ploy T. All measurements were performed in a 1.5 mol/L KCl buffer. MspA was added to cis. Oligonucleotides were added to cis with a final concentration of 200 nmol/L. A cyclic voltage protocol (+180 mV for 900 ms, –50 mV for 100 ms, 0 mV for 100 ms) was applied 1000 times to form a set of measurement. DNA blockade events were extracted using the “single channel research” option in Clampfit 10.7 (Molecular Devices)
Figure
3 ,Table
1 个