-
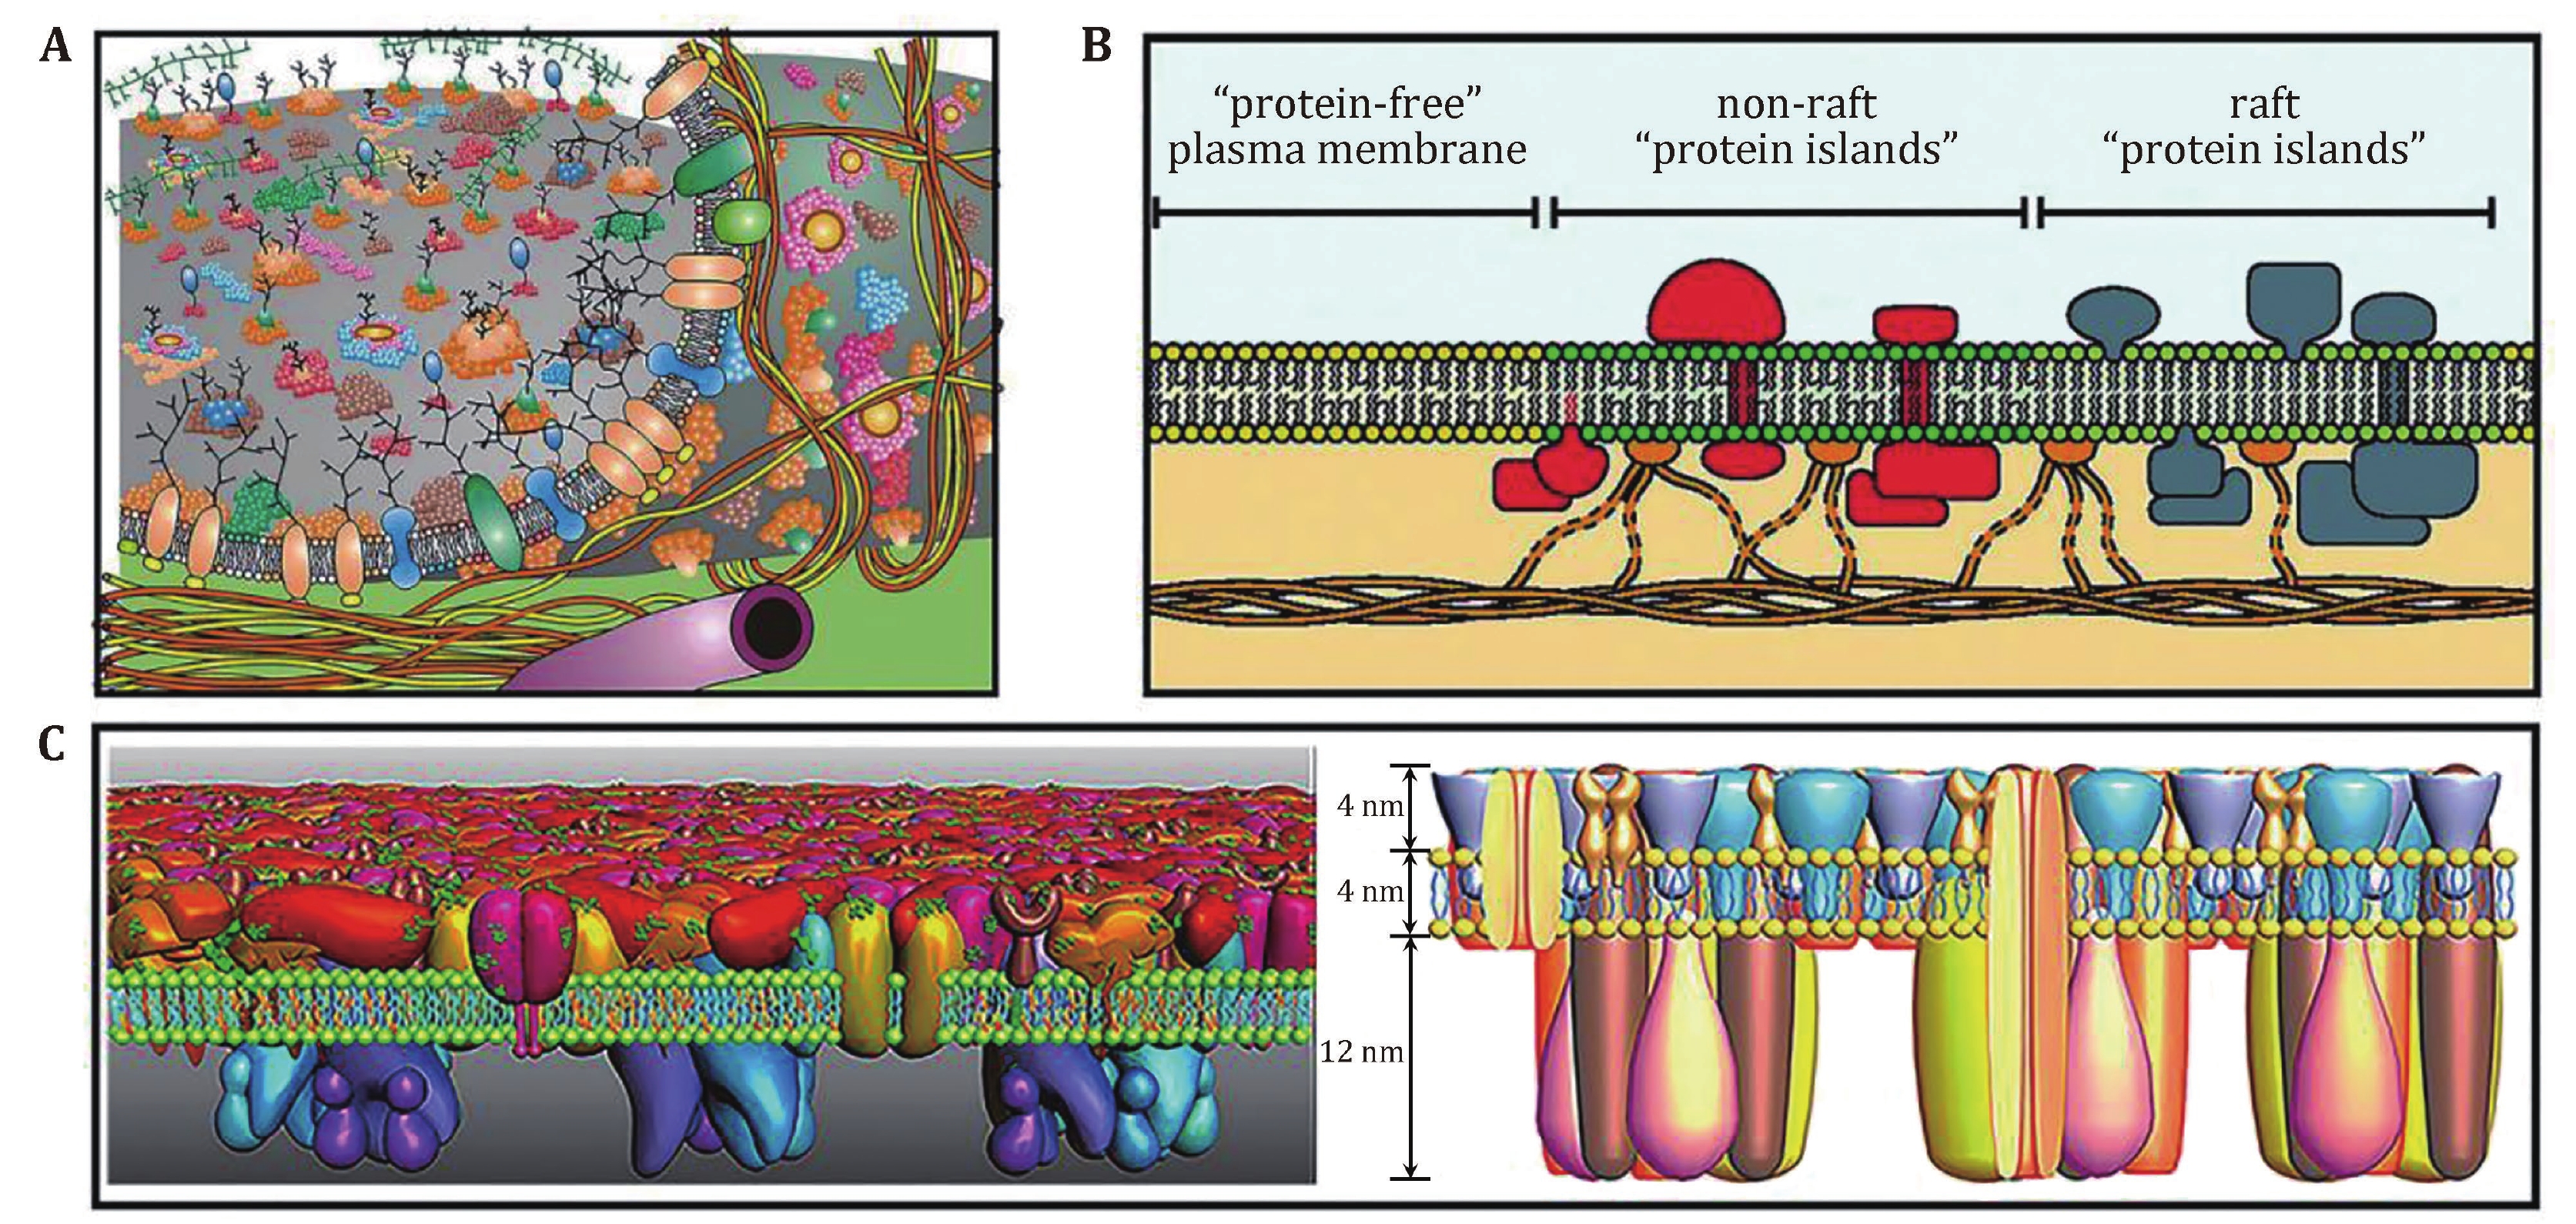
Figure 1. The proposed models of cell membranes. A An updated fluid mosaic membrane model that contains information on membrane domain structures, membrane-associated cytoskeletal, and extracellular structures. Reprinted from Nicolson (2014) with permission from Elsevier. B Lipid raft domains in cell membranes. Reprinted from Lillemeier et al. (2006) with permission from National Academy of Sciences, U.S.A. C Proposed protein layer-lipid-protein island (PLLPI) model of the cell membrane. The proteins on the ectoplasmic side of the cell membrane form a dense protein layer to show a smooth feature; the proteins on the cytoplasmic side tend to form dispersed microdomains (left). The total height of the cell membrane is 20 nm, which is composed of ectoplasmic protein layer (4 nm), lipid bilayer (4 nm), and cytoplasmic protein layer (12 nm) (right). Reprinted from Zhao et al. (2014) with kind permission from the Public Library of Science
-
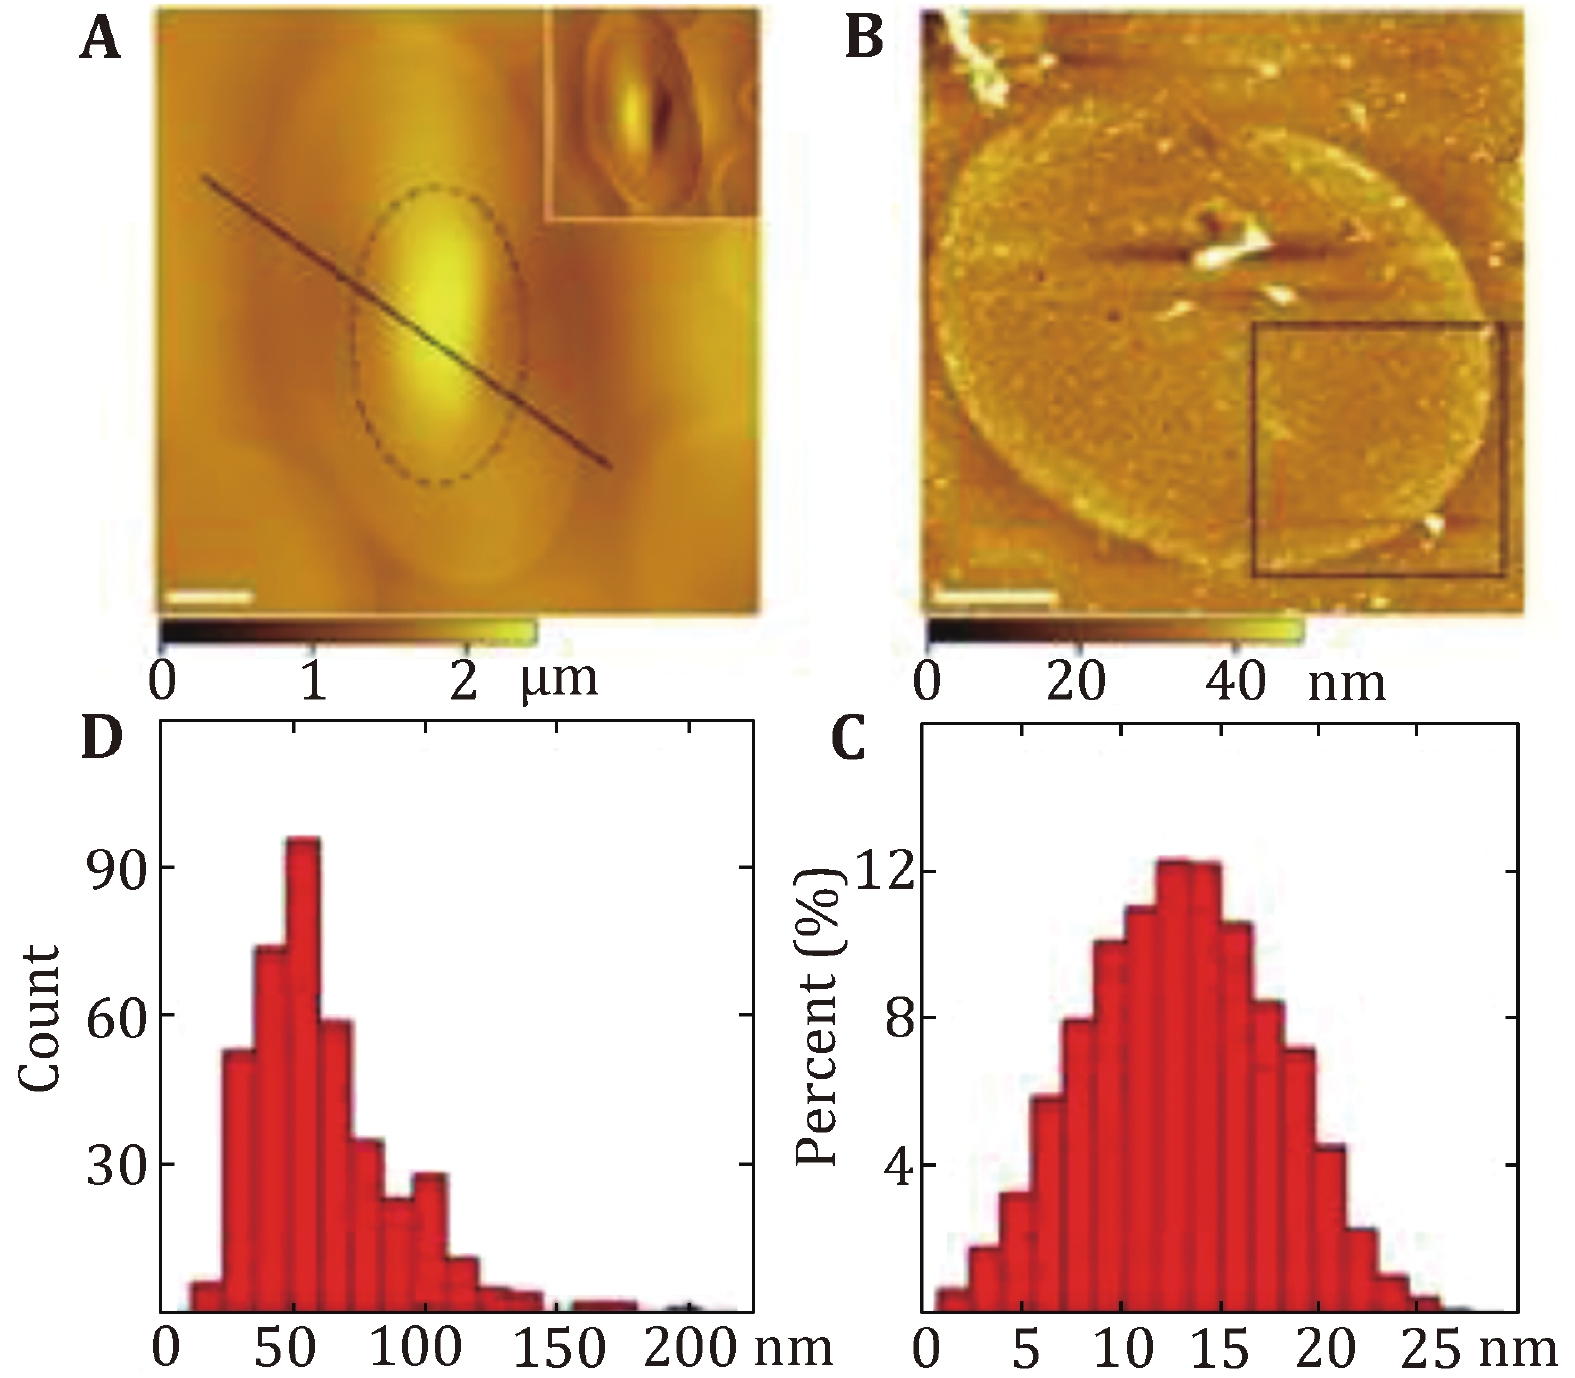
Figure 2. Characterization of the protein-covered cytoplasmic side of the turtle erythrocyte membranes. A AFM topographic images of the smooth outer surface of the turtle erythrocytes membranes. B AFM topographic image of the cytoplasmic side membrane. Scale bar: 5 µm in A and B. C The height of proteins above the membrane ranges from 1 to 27 nm with the peak at 10–16 nm. D The diameter distribution of proteins in the cytoplasmic side membrane varies from 15 to 200 nm with 70% falling between 40 and 80 nm. Reprinted from Tian et al. (2014a) with permission of Korean Society for Molecular and Cellular Biology
-
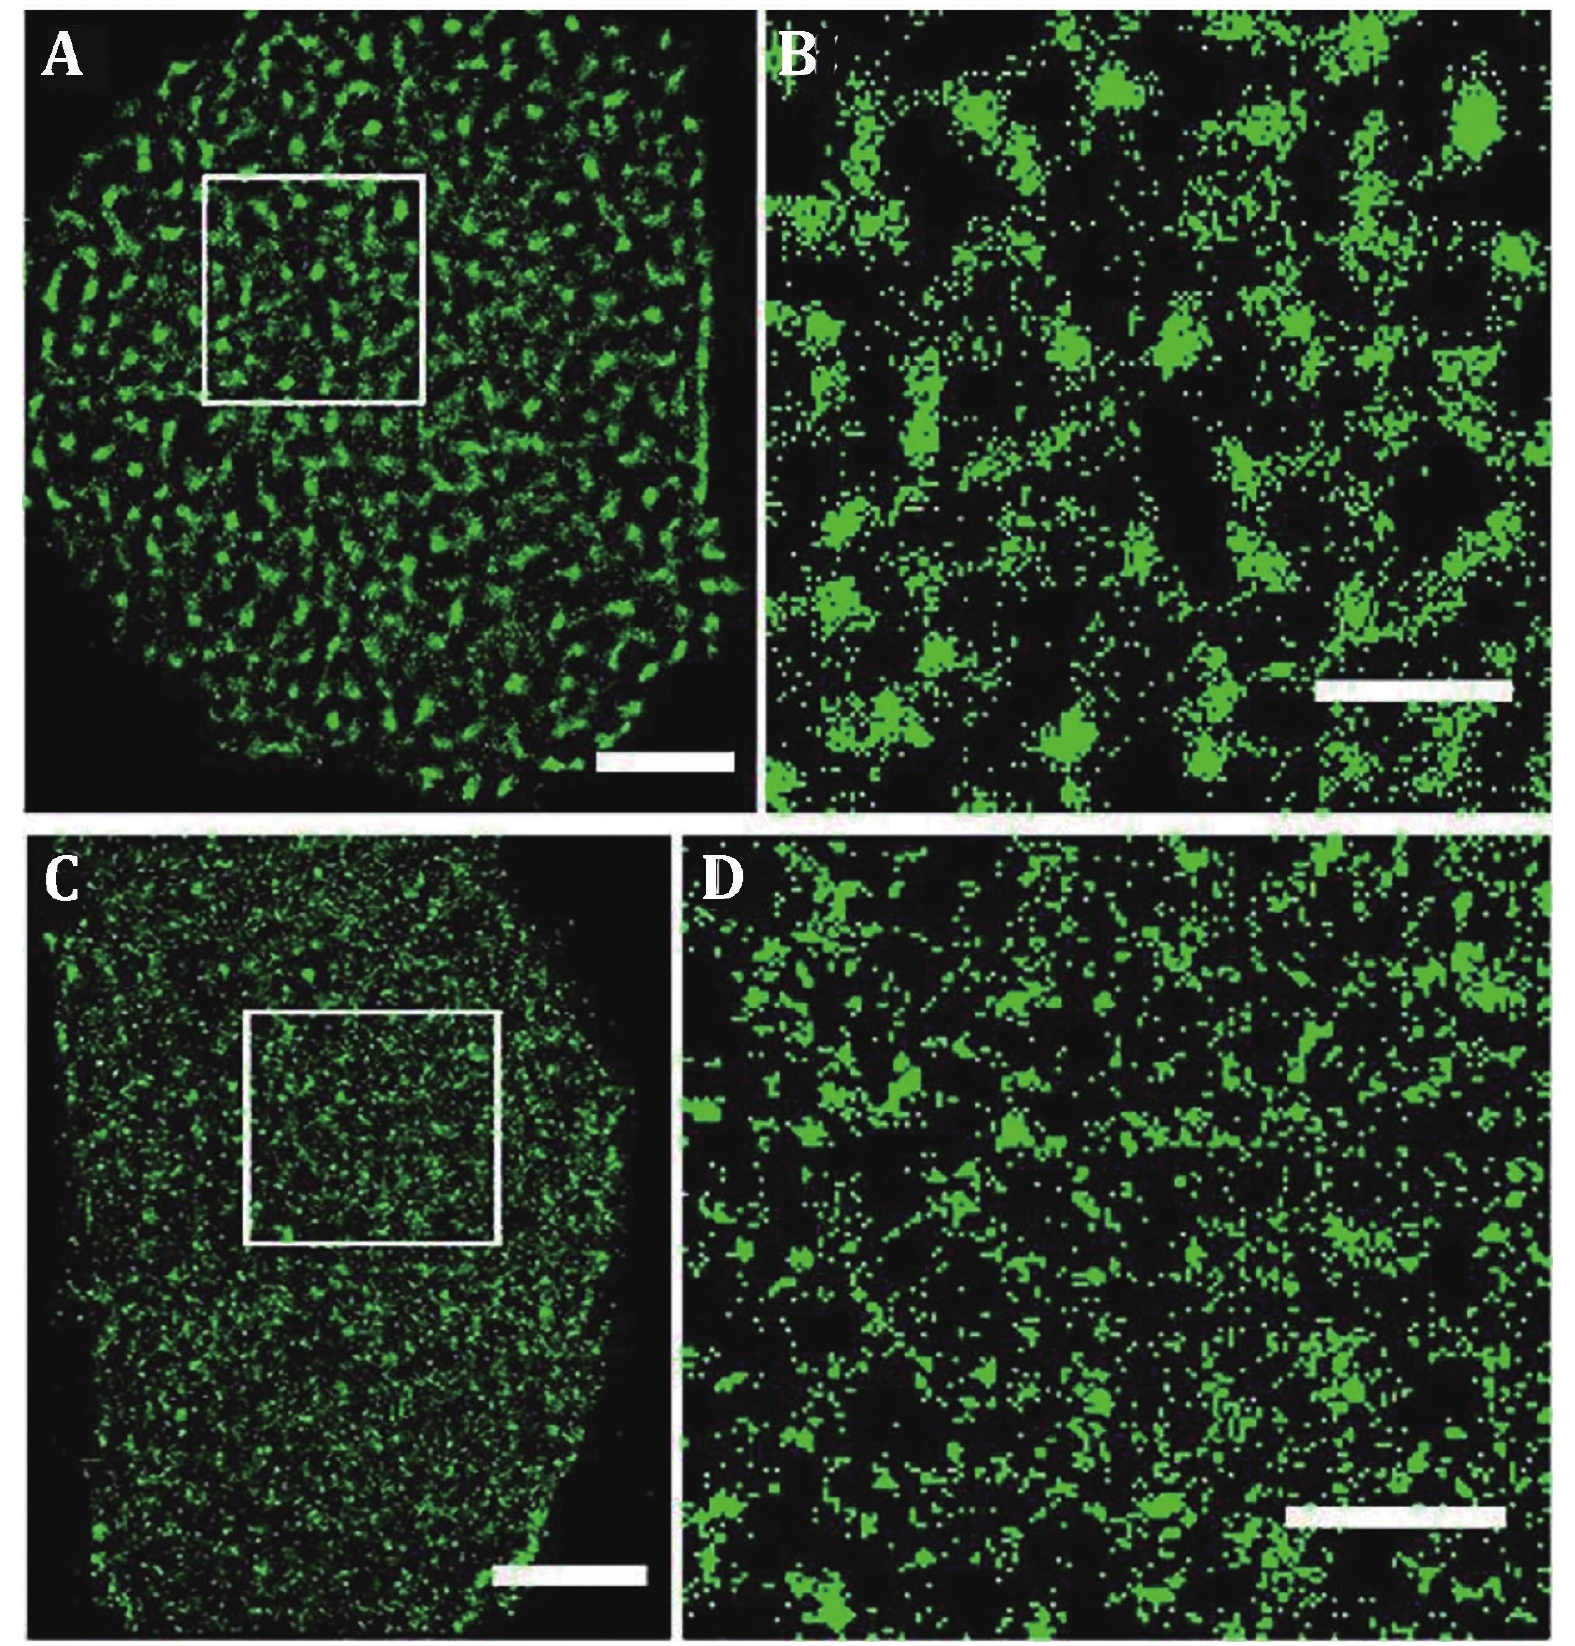
Figure 3. GLUT1 proteins form clusters of different sizes and amounts on HeLa cell medium exposed side and adherent side. GLUT1 antibody was labeled with Alexa532. Reconstructed dSTORM images of GLUT1 on medium exposed side (A) and adherent side (C). The corresponding magnified images (B and D). Scale bars: A and C, 5 μm; B and D, 2 μm. Reprinted from Yan et al. (2018) with permission of National Academy of Sciences, USA
-
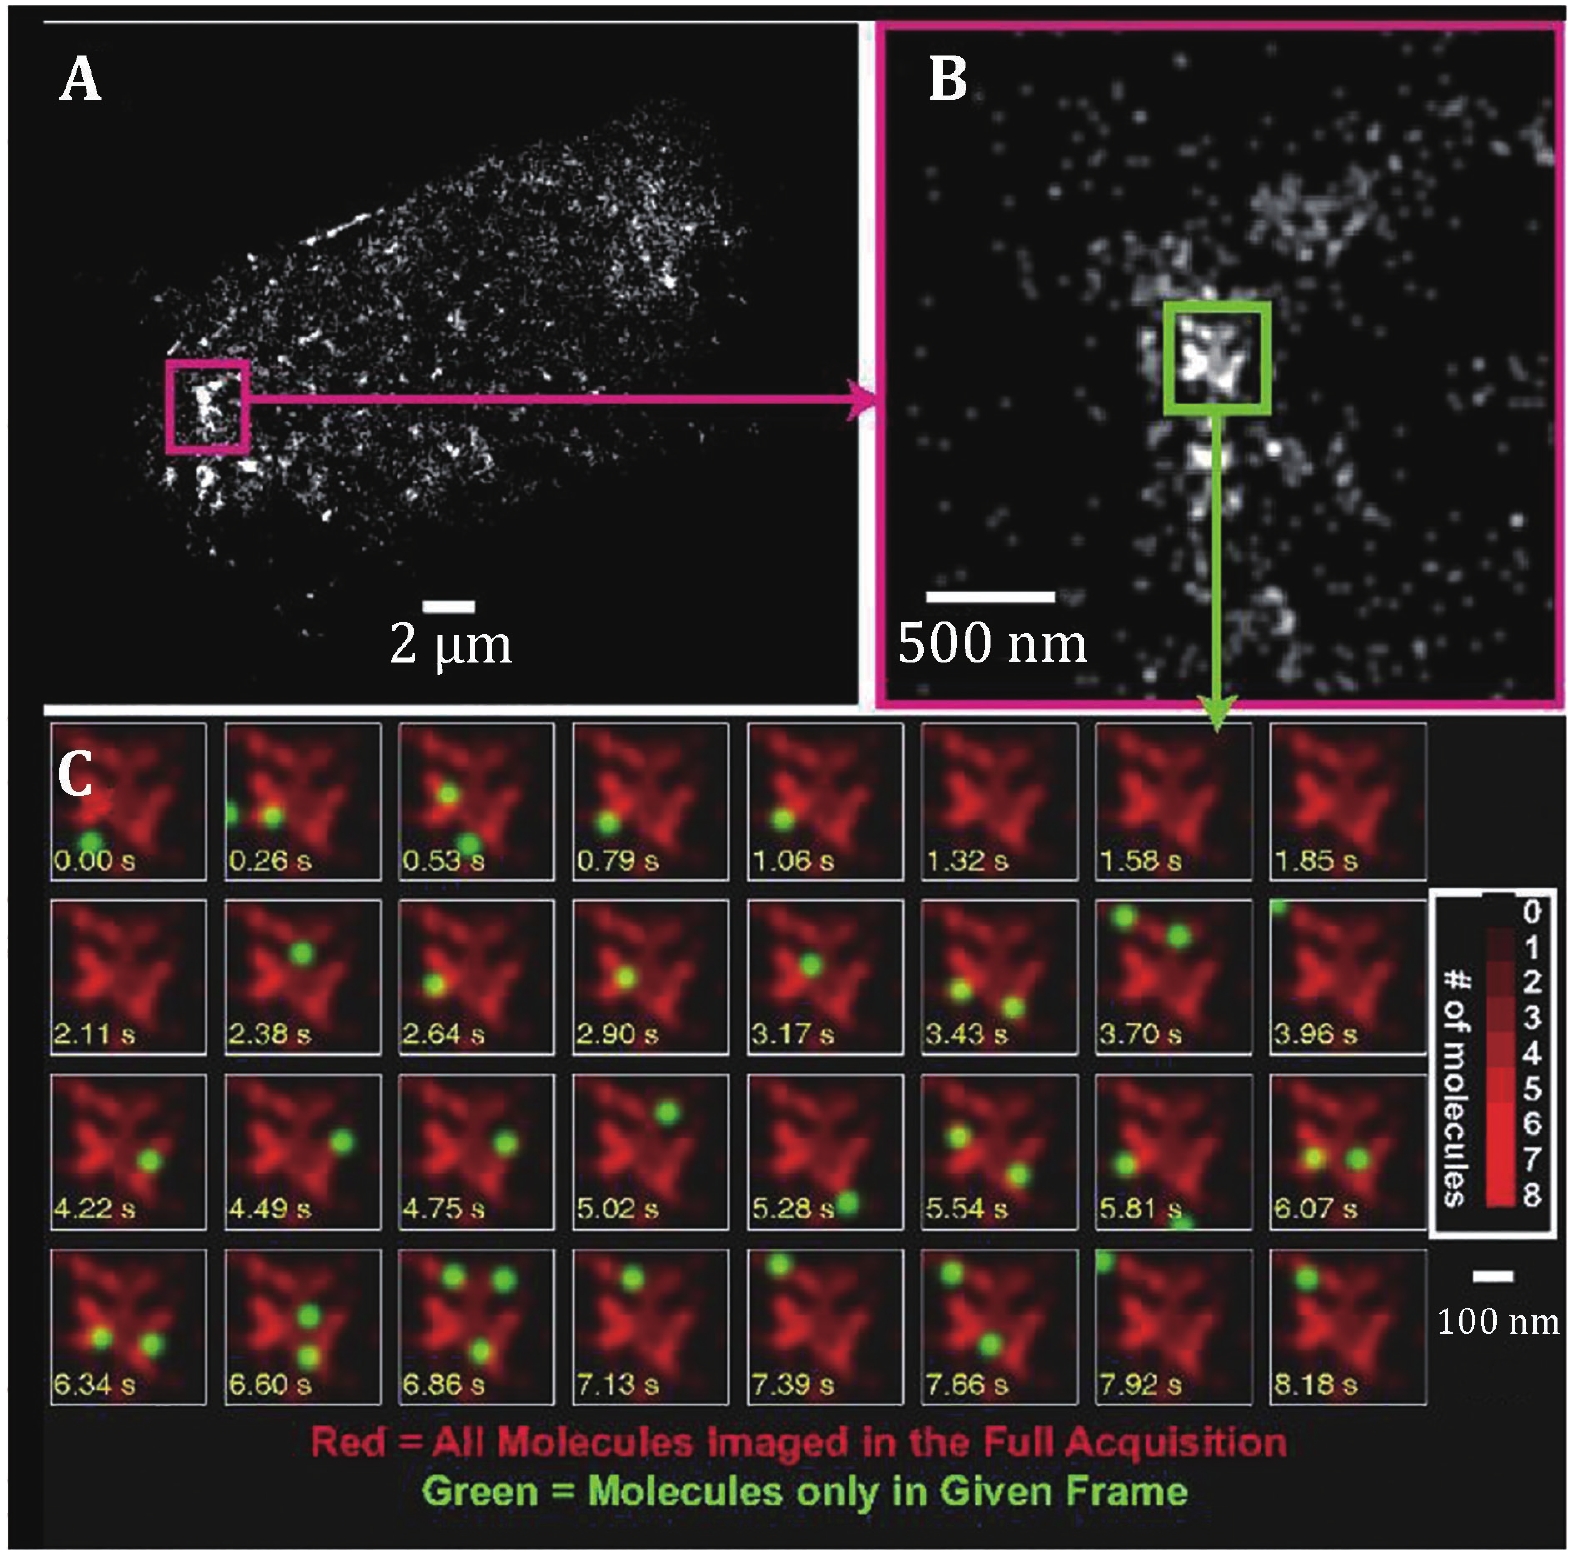
Figure 4. Time dependence of positions of localized HA molecules within an HA cluster in a live fibroblast at room temperature. A PALM image of a whole cell. B Zoomed view of area in A enclosed in dashed magenta box. C Successive frames from the 0.4 µm × 0.4 µm region outlined by the green box in B. Time is shown on each frame in seconds (yellow text); molecules localized in the current frame are shown as green spots superimposed on a red image of all molecules localized within that region during the full acquisition. Many molecules are visible for more than one frame (typically two to five frames) before photo bleaching. Molecules are plotted as Gaussian spots with a radius of 40 nm. Brighter regions in the image correspond to larger numbers of molecules (see color bar). Reprinted from Hess et al. (2007) with permission of National Academy of Sciences, USA
-
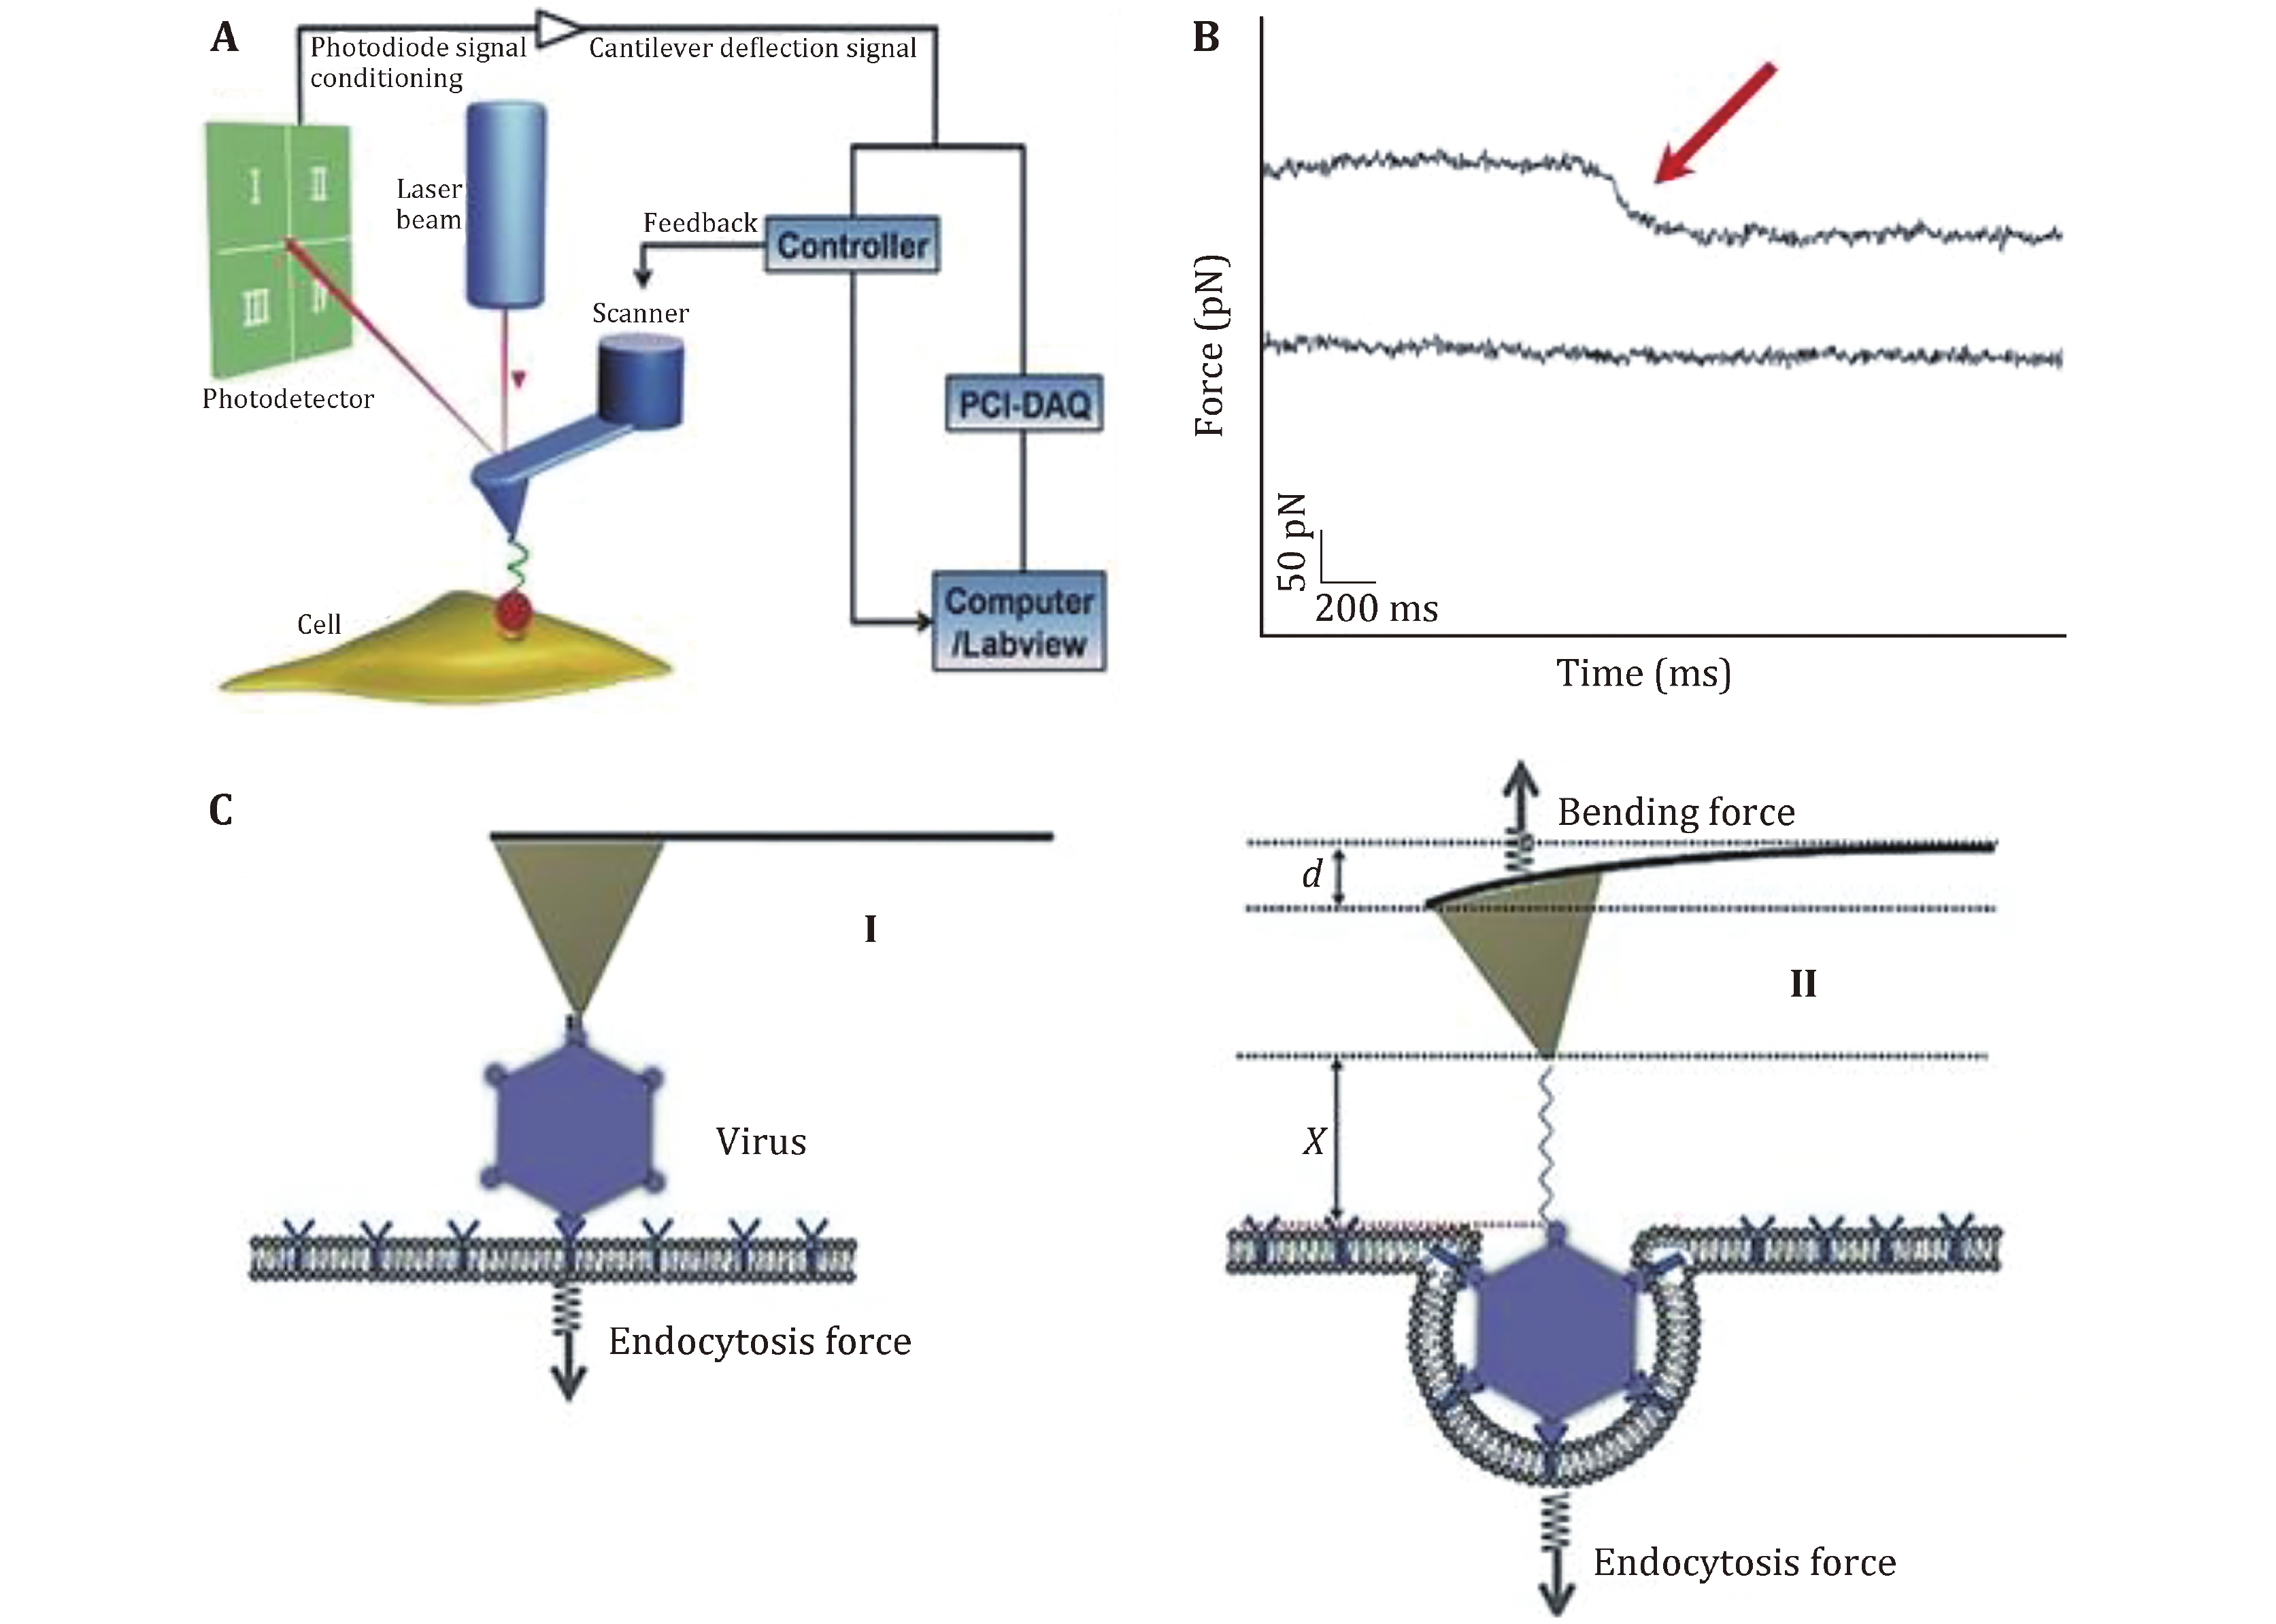
Figure 5. Schematic diagram of the force tracing technique for detecting the viral invagination. A Schematic diagram of the force tracing technique in constant position mode. The AFM tip modified with virions moves toward the cell surface and contacts the living cell at a constant position. B Typical force tracing curves (upper) of virus entry into the cell. No signals (lower) were observed when blocked with inhibitors. C The scheme of viral invagination via cell membranes. Reproduced from Pan et al. (2017) with permission of John Wiley & Sons Ltd
Figure
5 ,Table
0 个