-
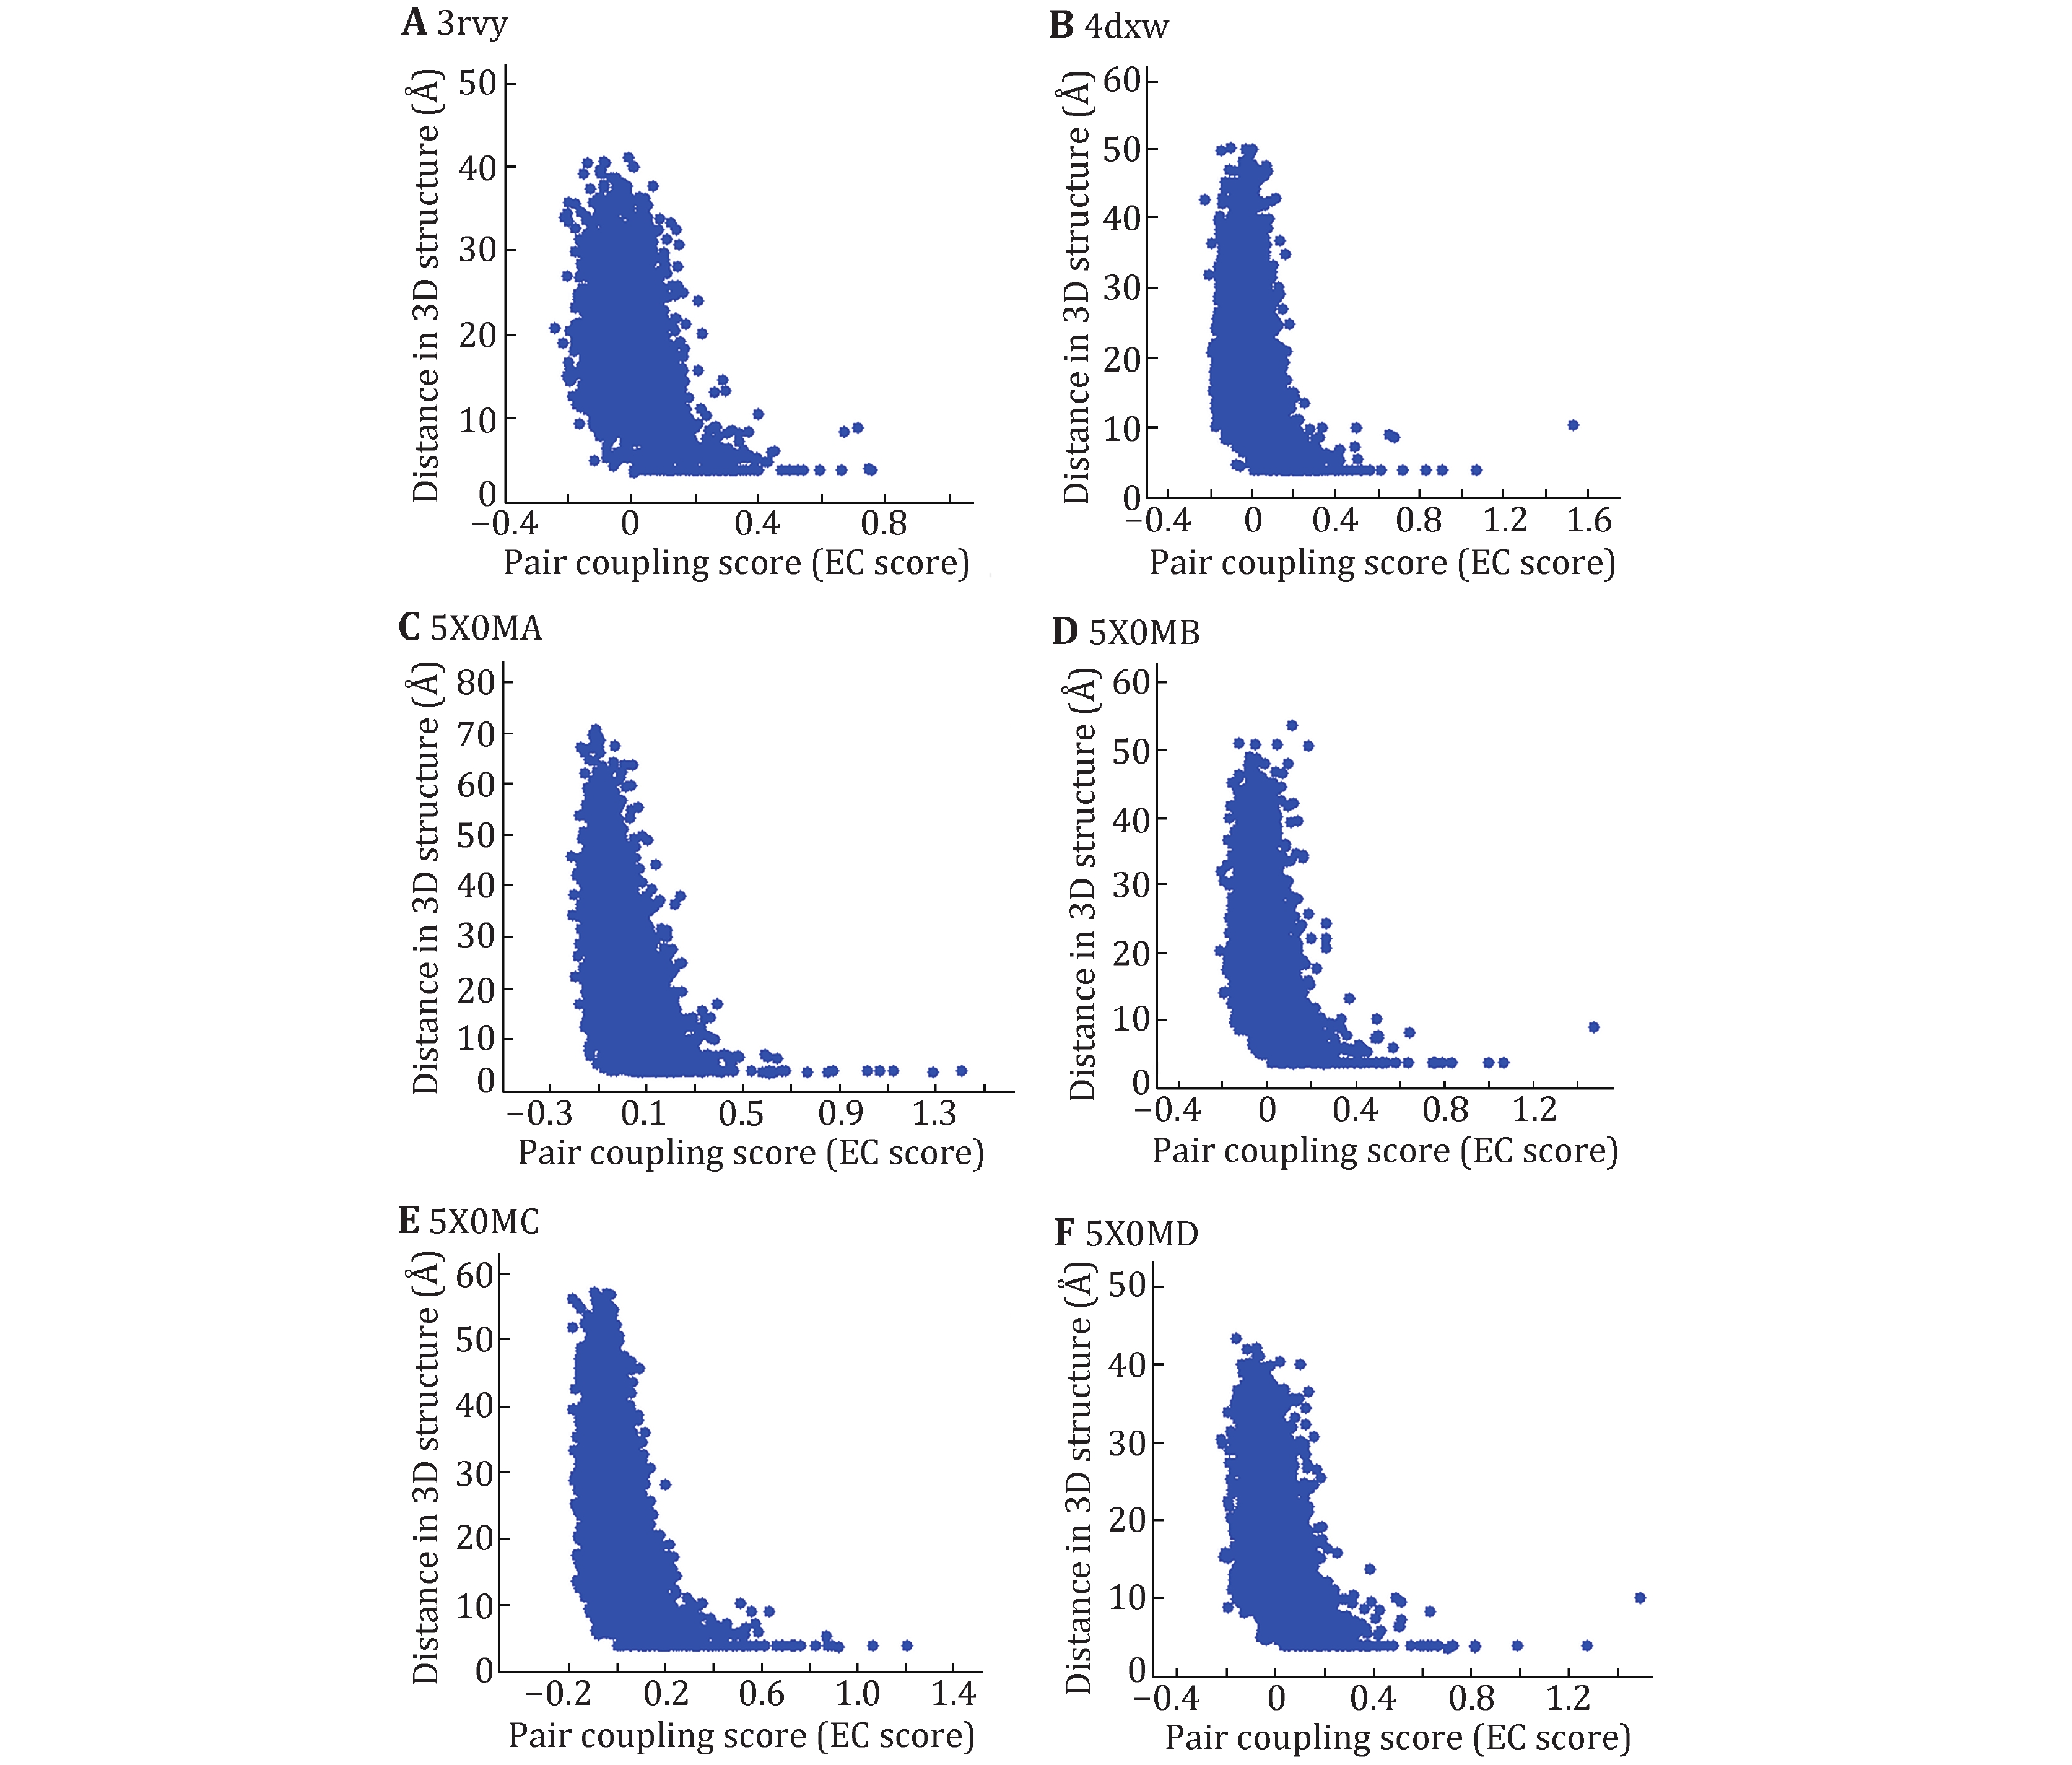
Figure 1. Maps of EC score and residue–residue distances for the three Nav channels with known tertiary structure. 3rvy (A), 4dxw (B) and the four domains of 5x0m (C–F). X axis is EC score and Y axis is residue–residue distance in the 3D structure
-
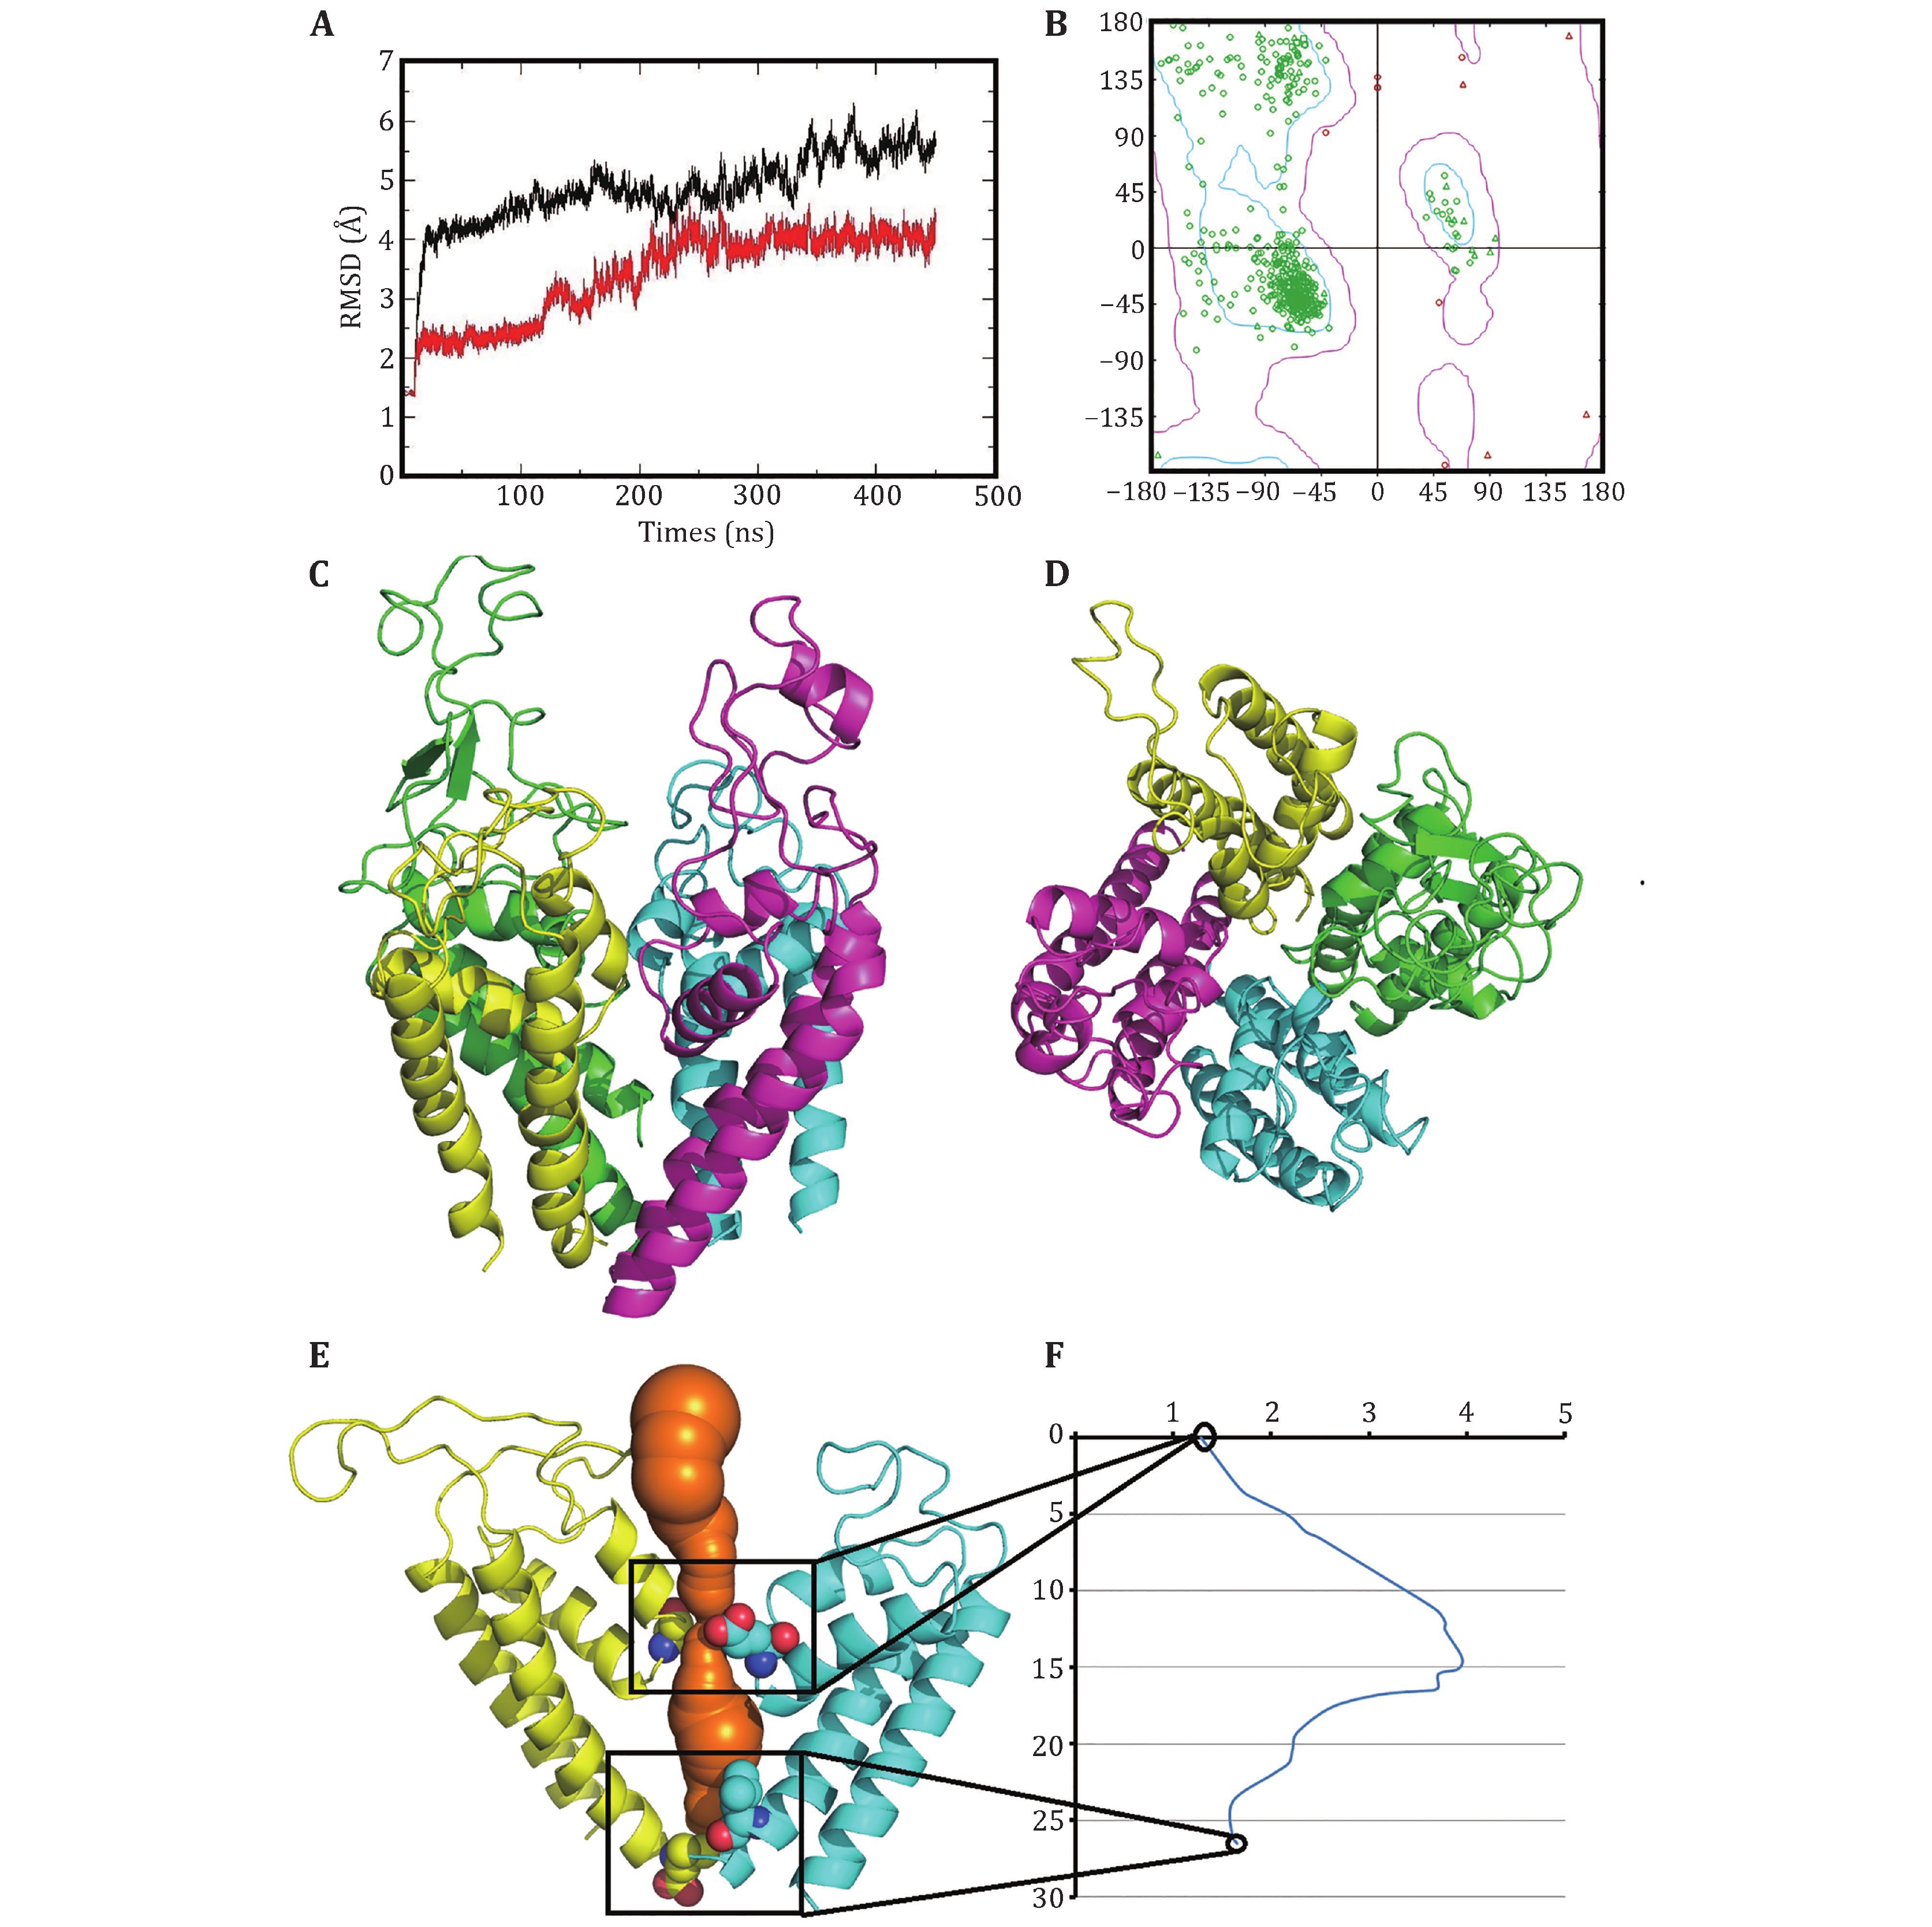
Figure 2. Optimized structure of the closed10. A The changes of the RMSDs of Cα atoms of the closed10 with (black line) and without (red line) outer membrane P-loops during 450-ns MD simulation. B Ramachandran plot of the optimized structure. The side (C) and top (D) views of the optimized structure, generated by pymol (Lilkova et al. 2015) and colored by chain (green, cyan, purple and yellow for D1−D4). The channel (in orange) (E) and its radius versus distance along the channel direction (F)
-
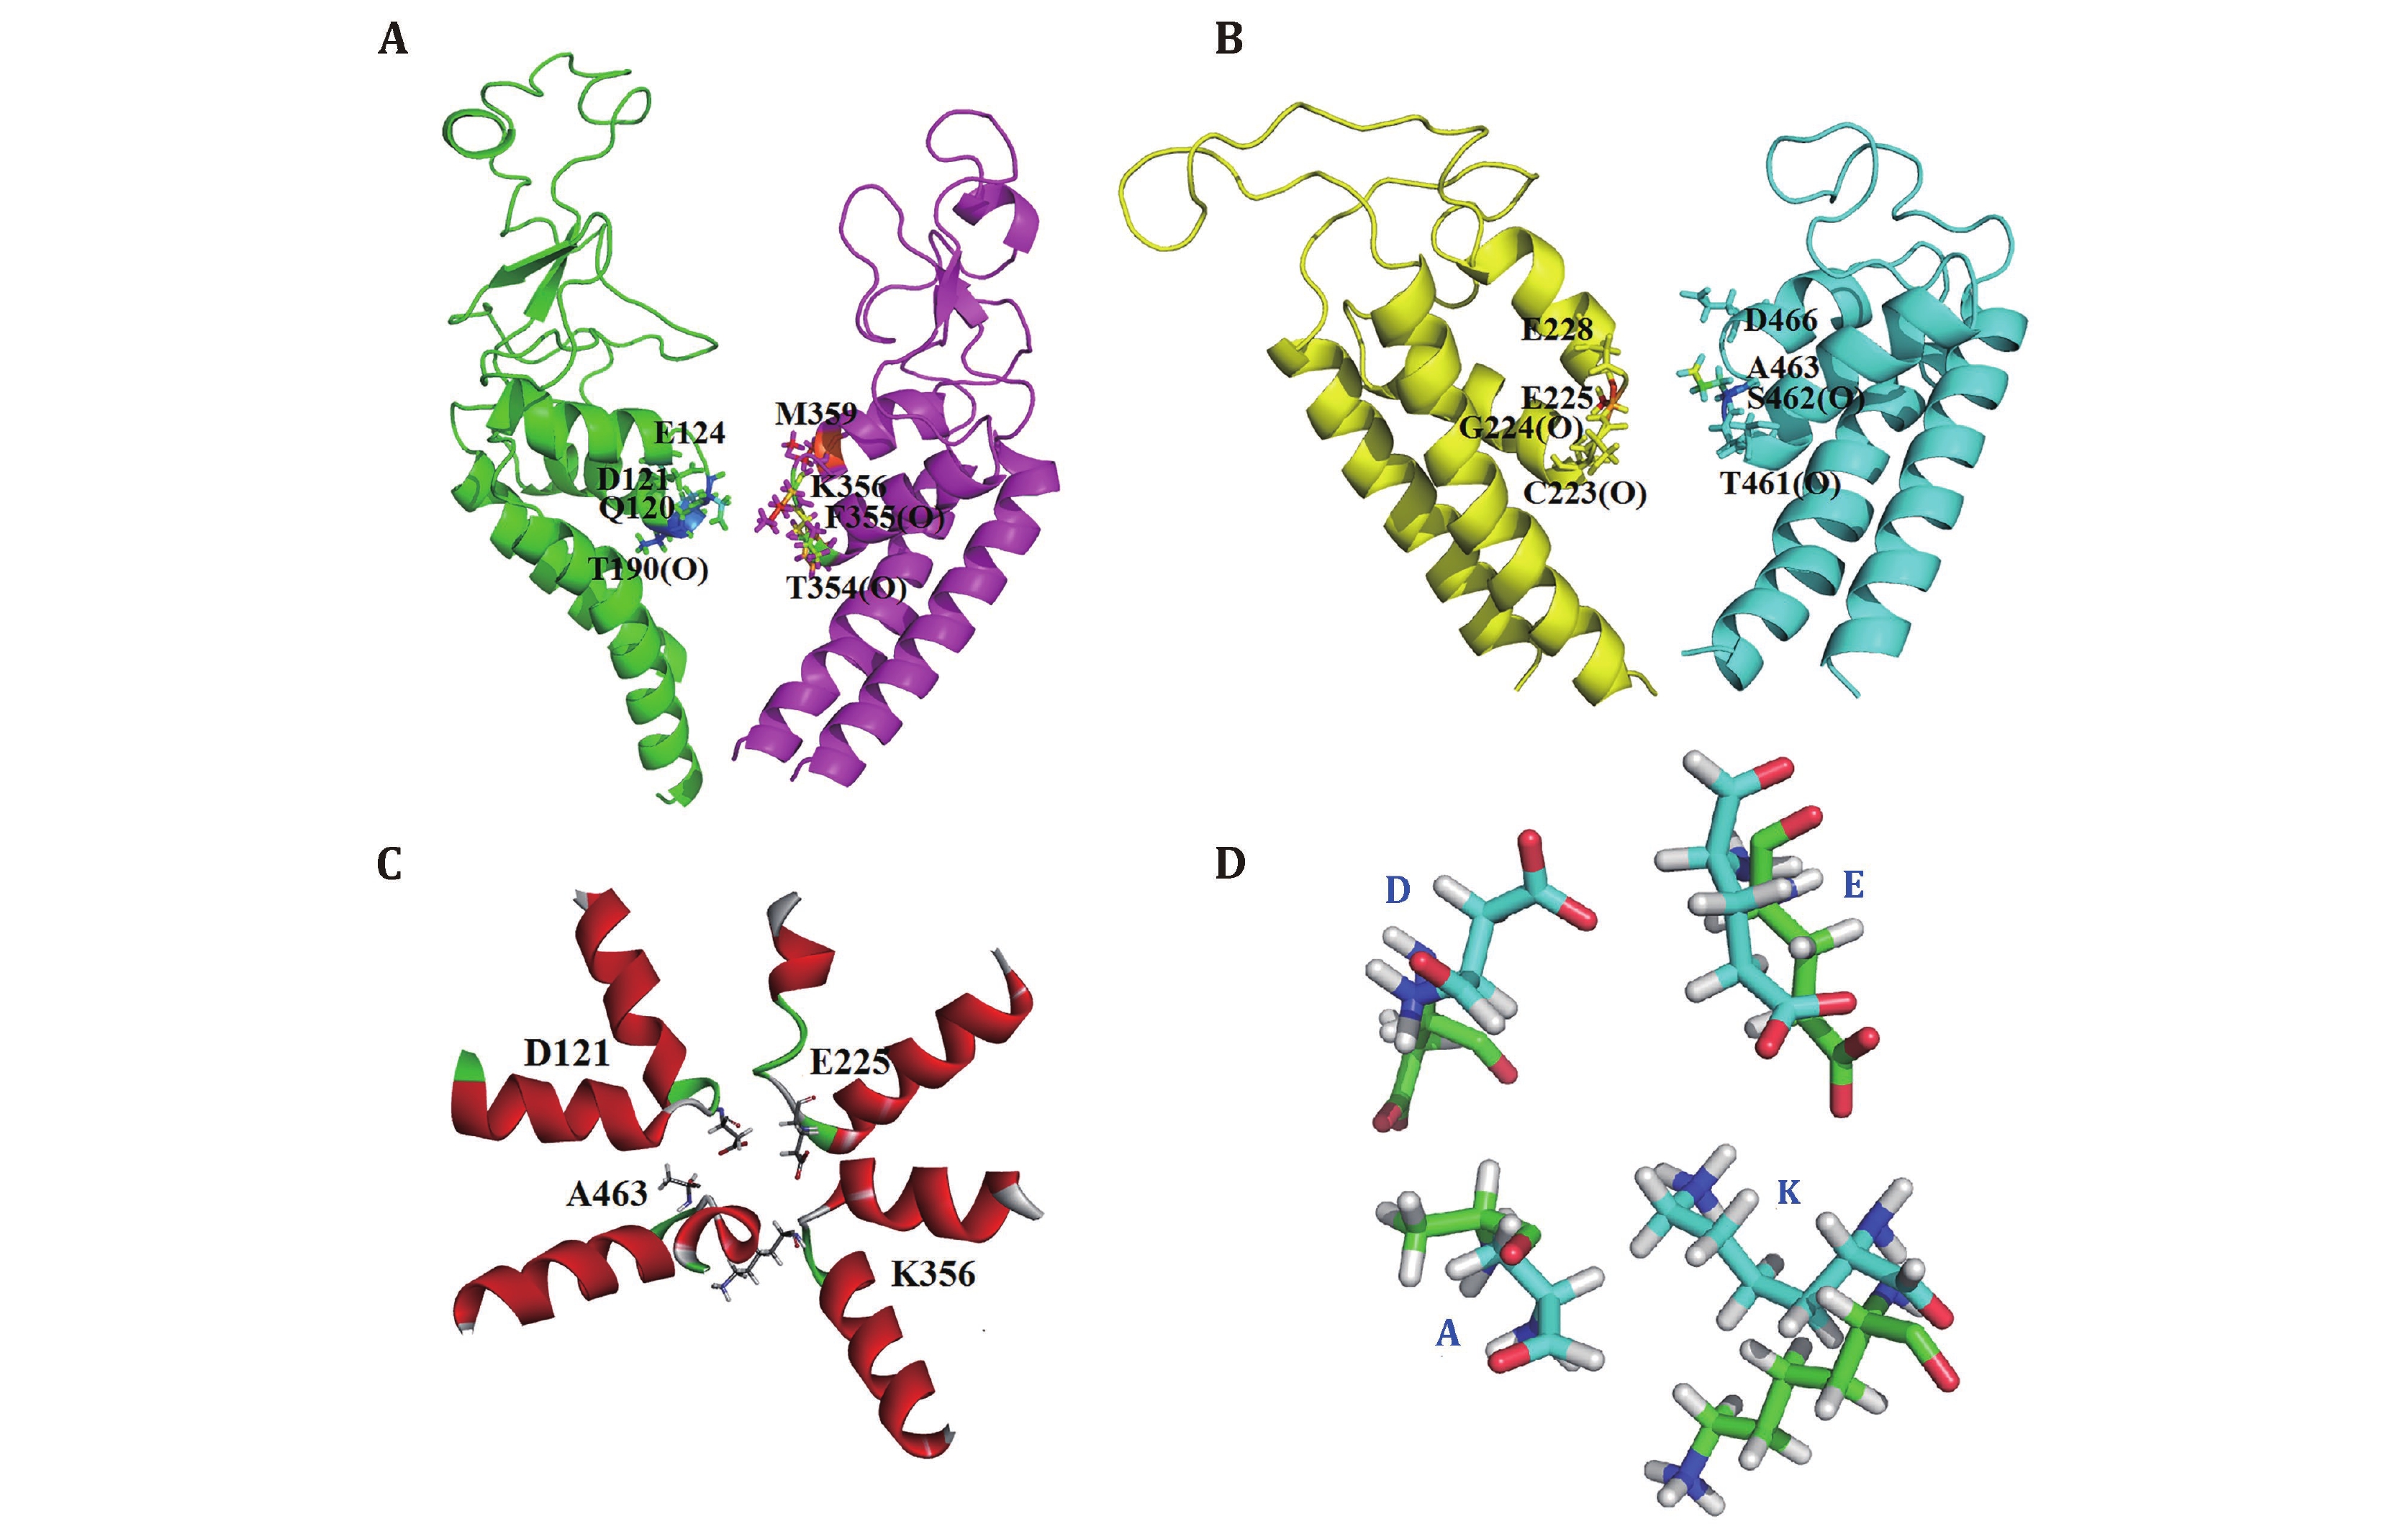
Figure 3. The selectivity filter (SF) of the model closed10. A, B The SF residues D121/E225/K356/A463 with their two preceding residues and the residues that constitute the negative ring above the SF vestibule. All these residues are represented in stick. C SF top view is shown. D SF structural variations of closed10 (green) and NavPaS (cyan)
-
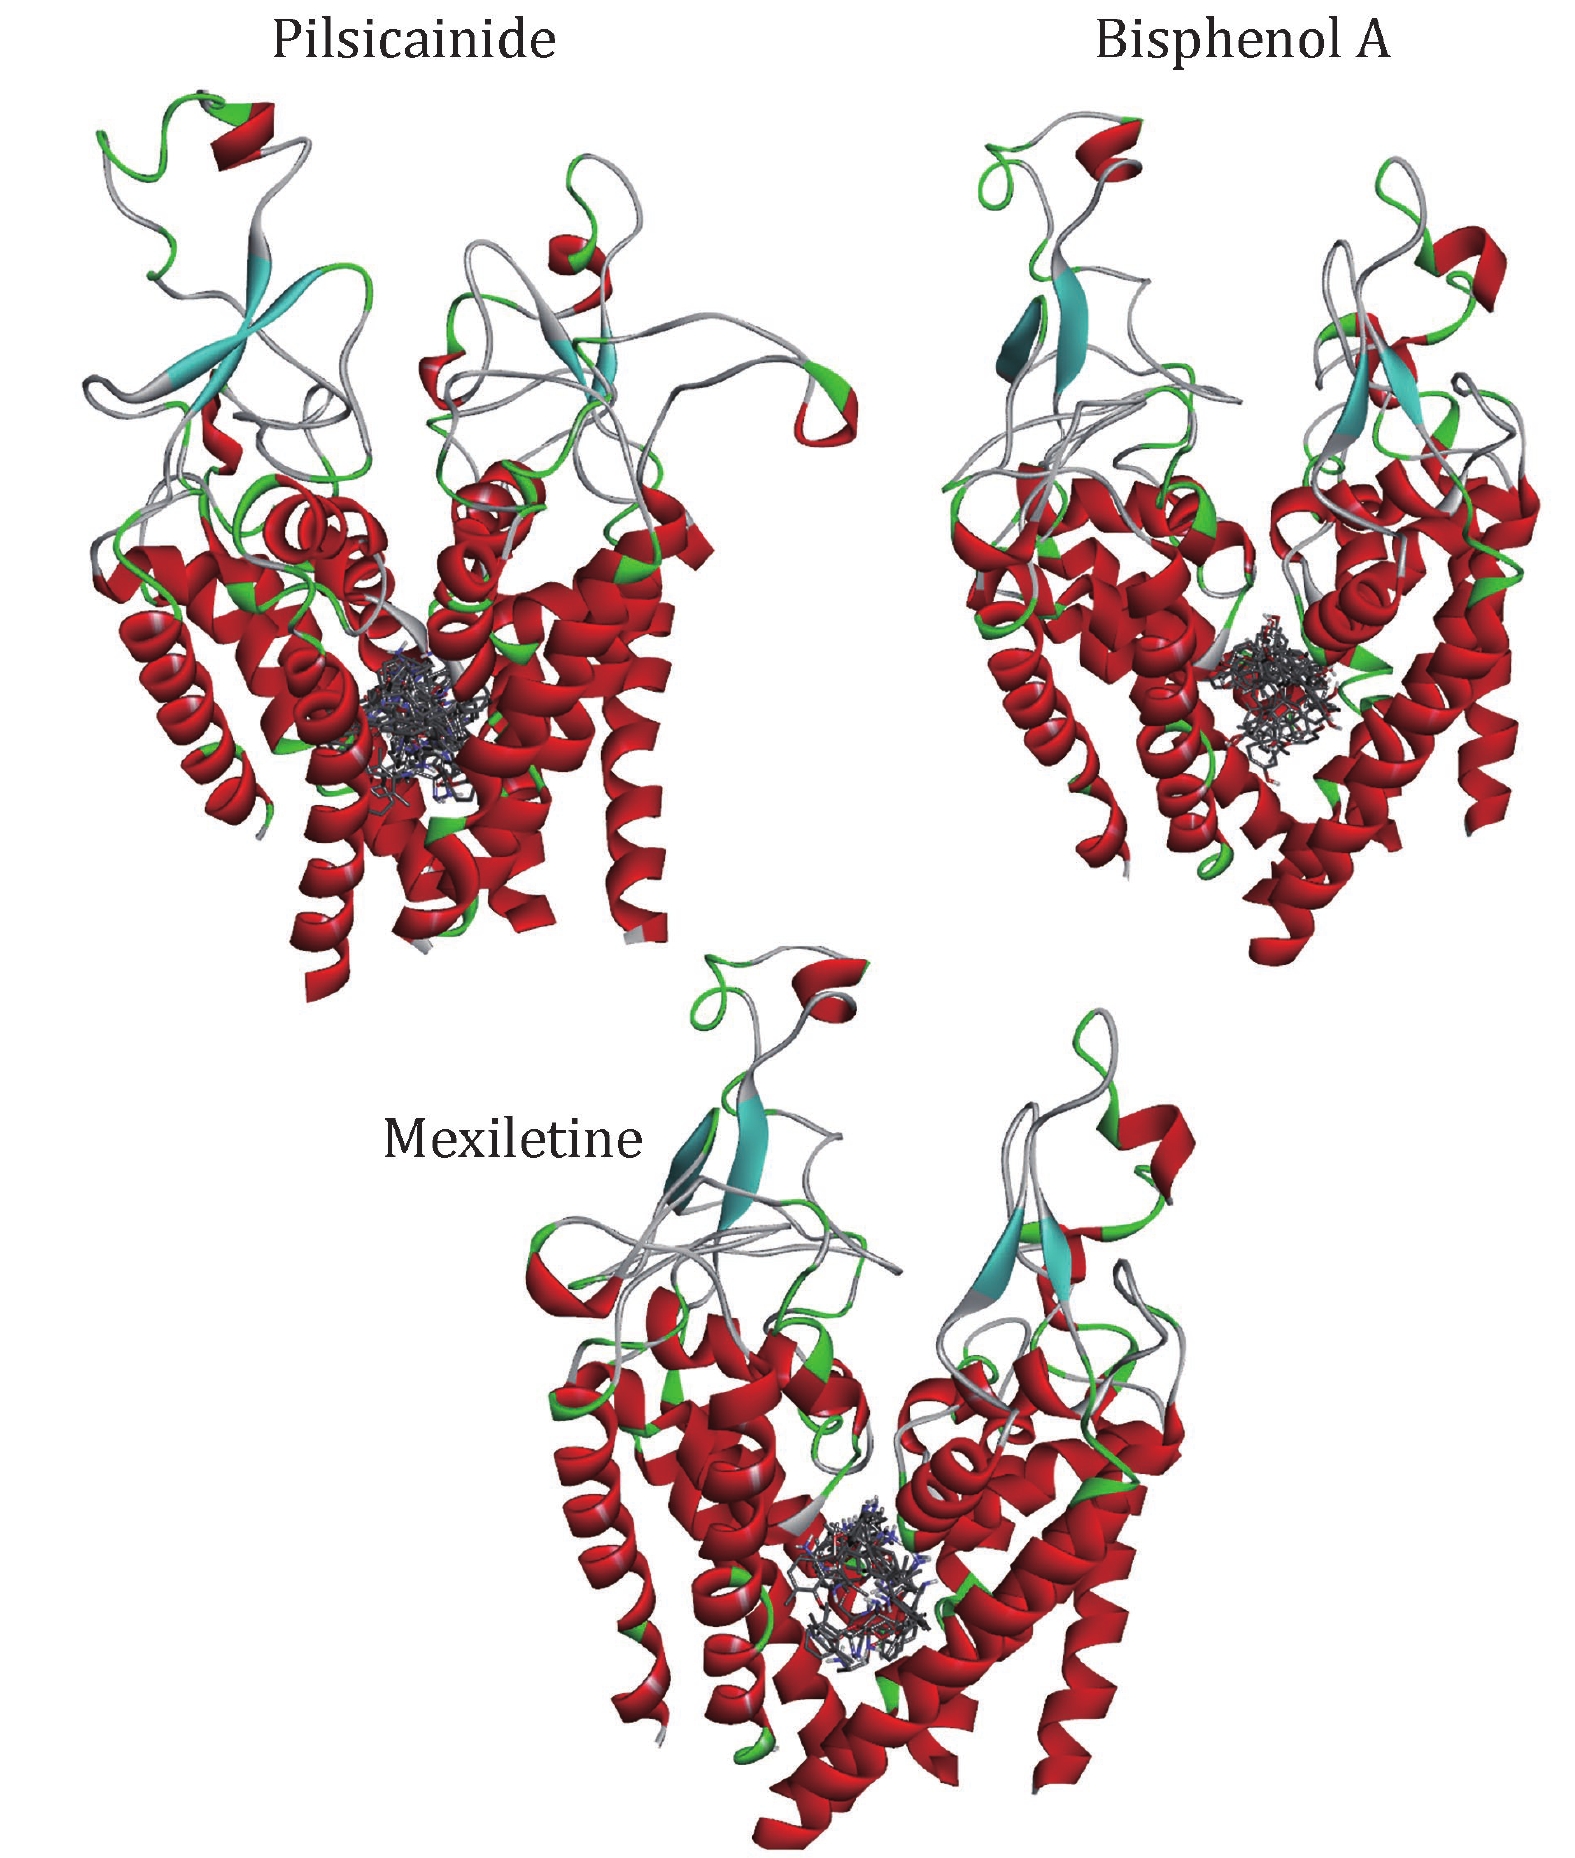
Figure 4. The relative position of docking conformations of LAs with the closed10. The plot is generated by DS Visualizer 4.2, protein structures are shown in cartoon and drugs are shown in sticks
-
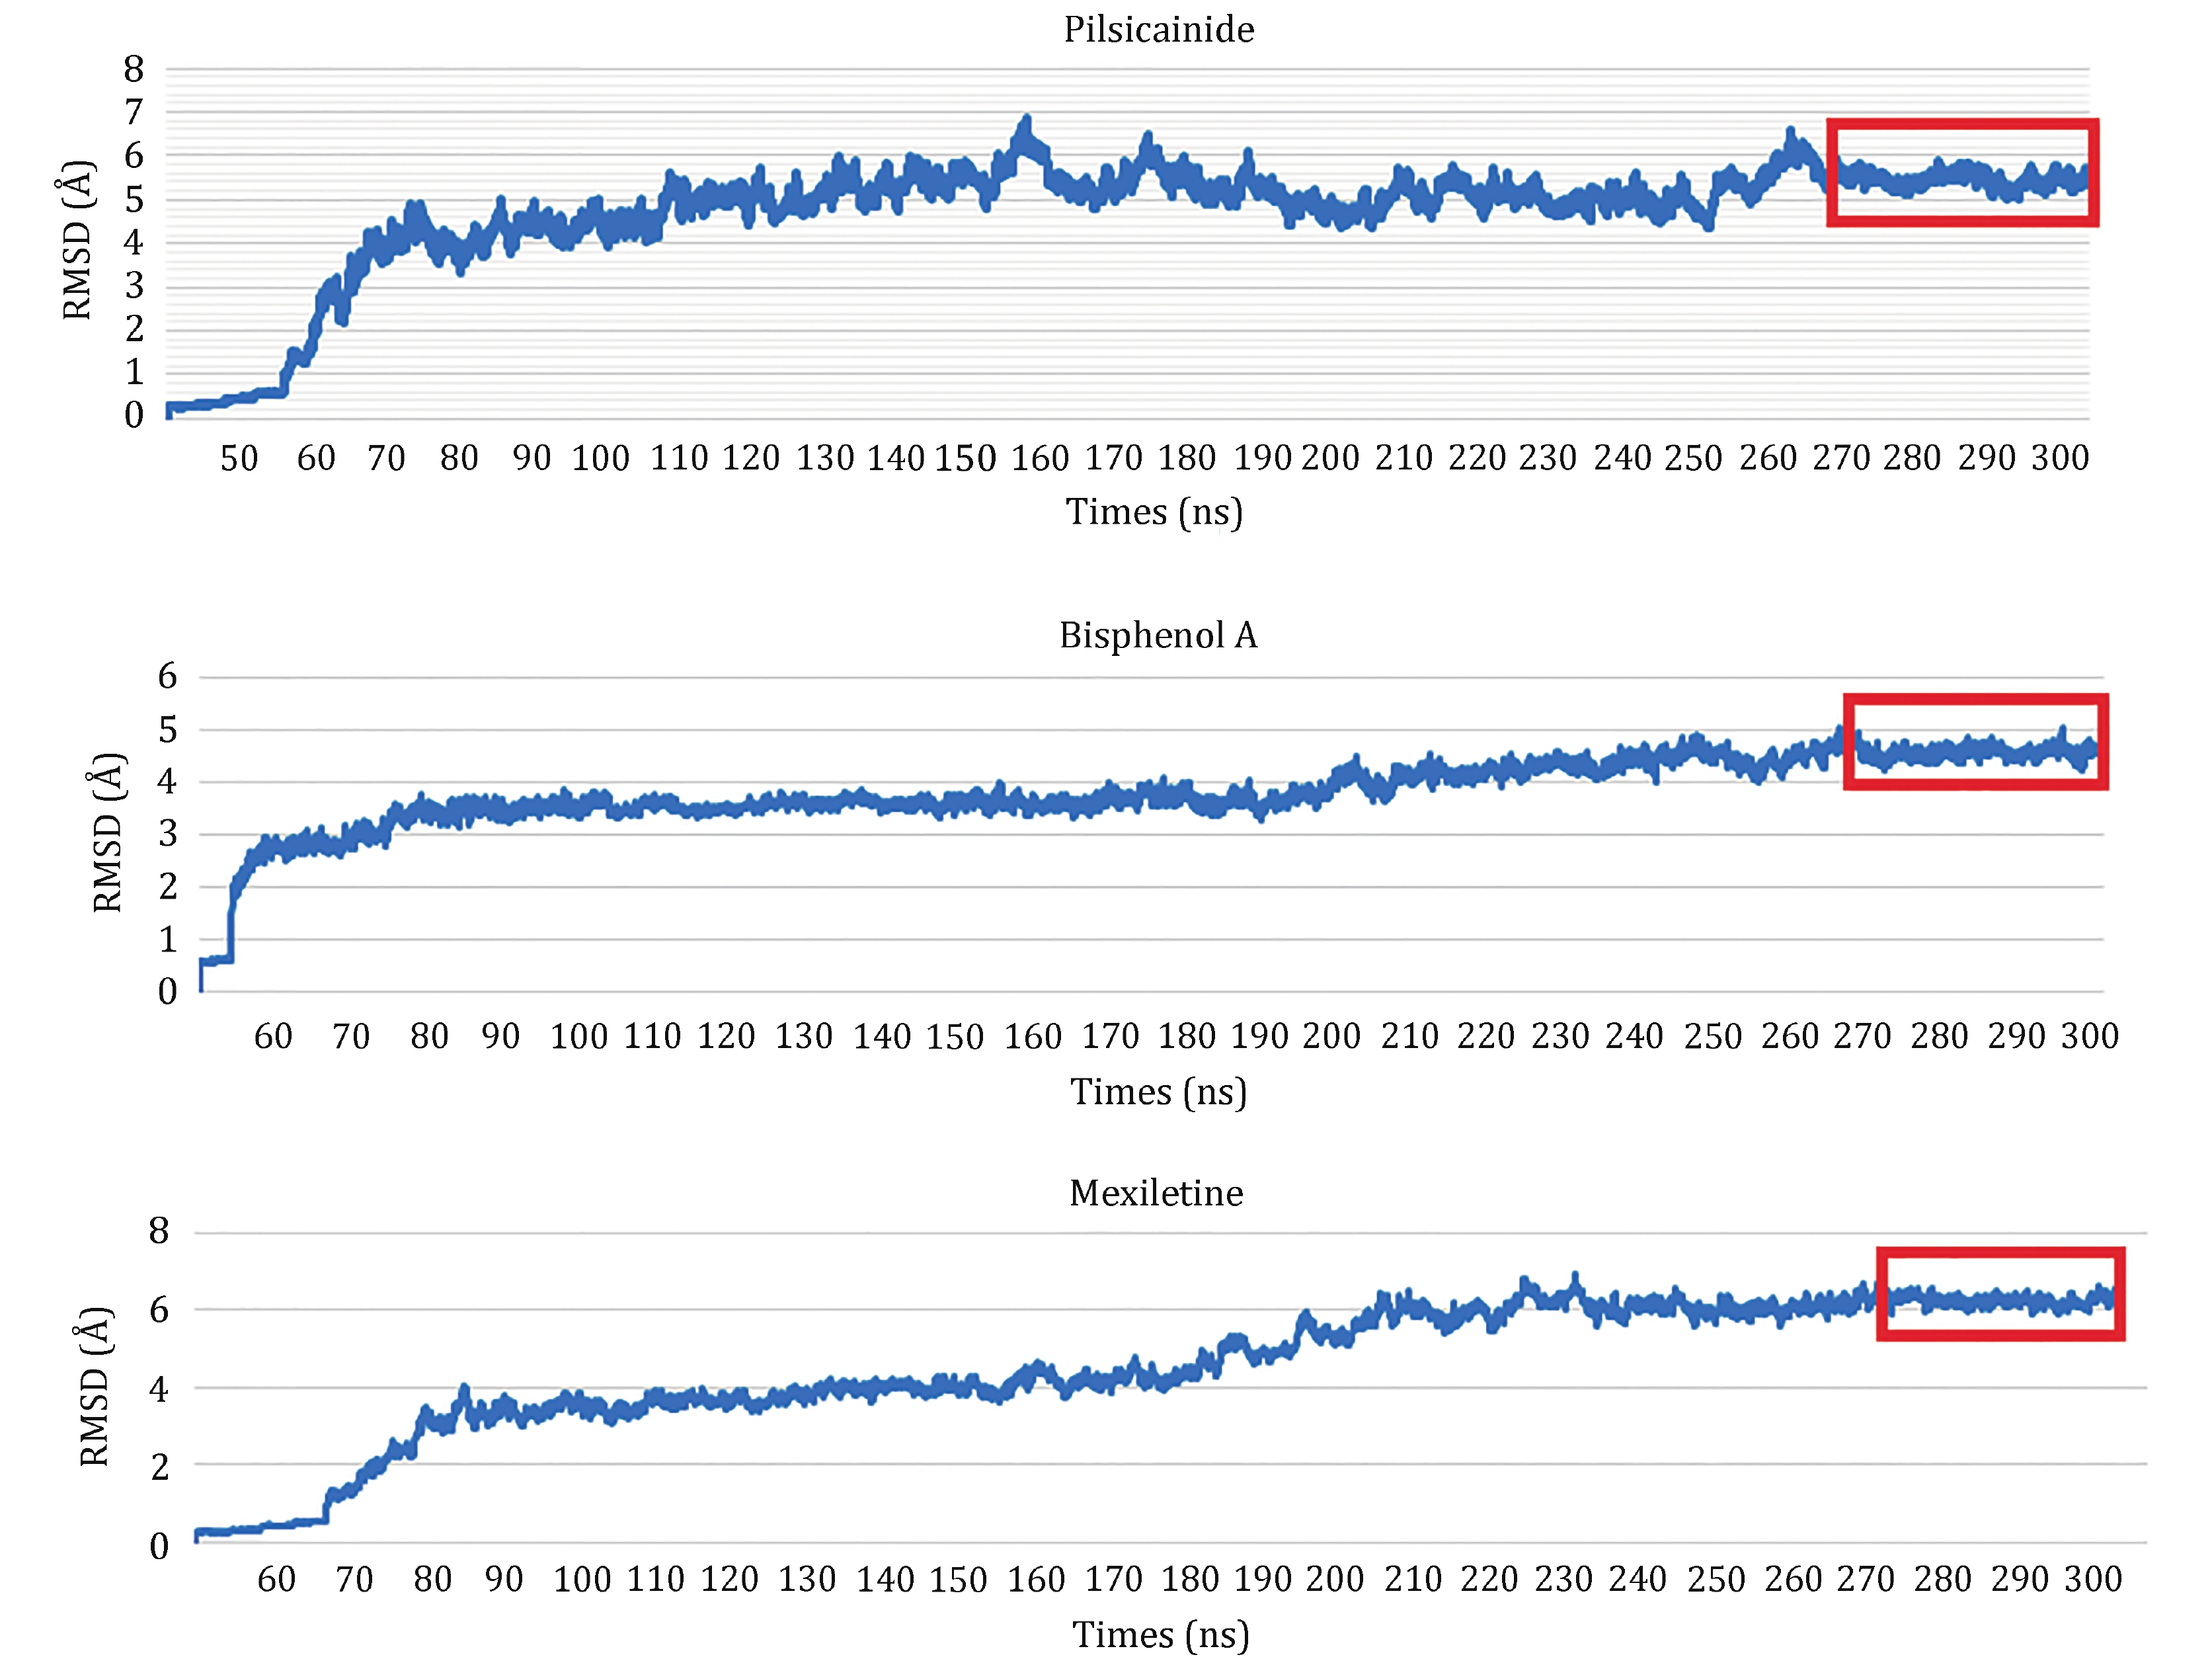
Figure 5. RMSDs for the complexes of Nav1.5_Las. The trajectories in the red rectangles are used to calculate binding energies
-
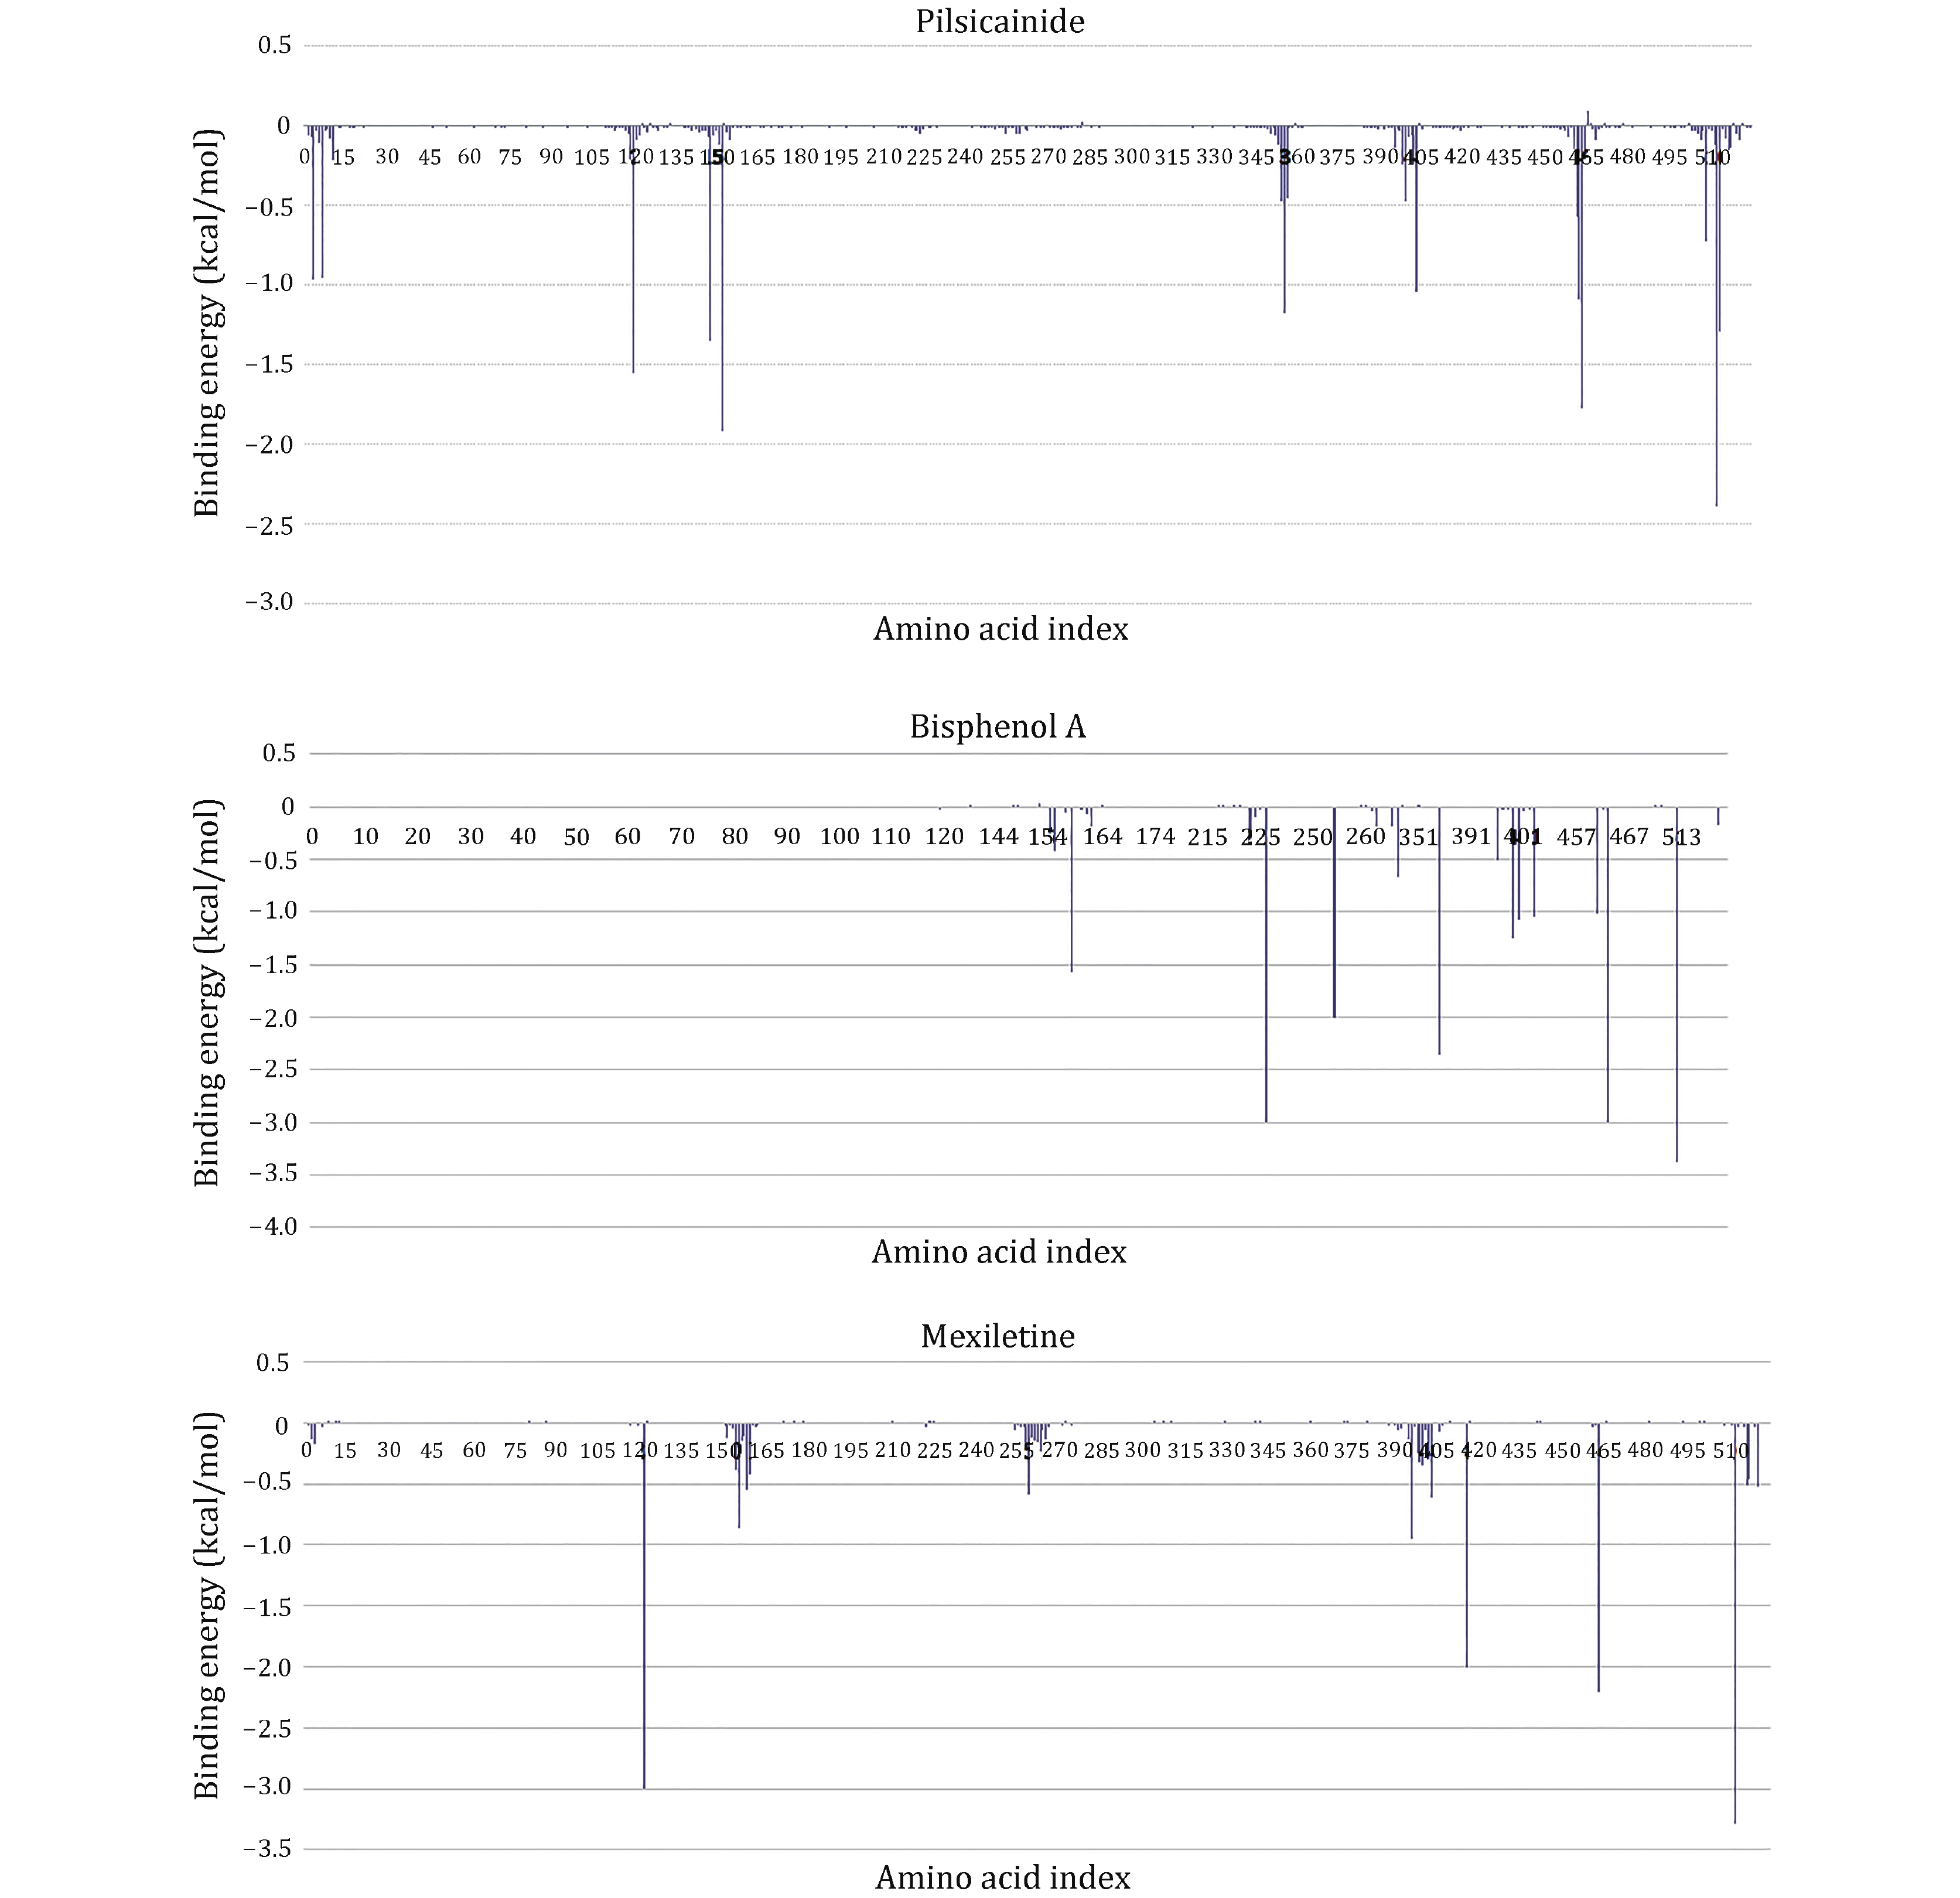
Figure 6. Residue interaction spectrum between the closed10 and three closed-state LAs. The horizontal axis is amino acid index and the vertical axis is the binding energy
-
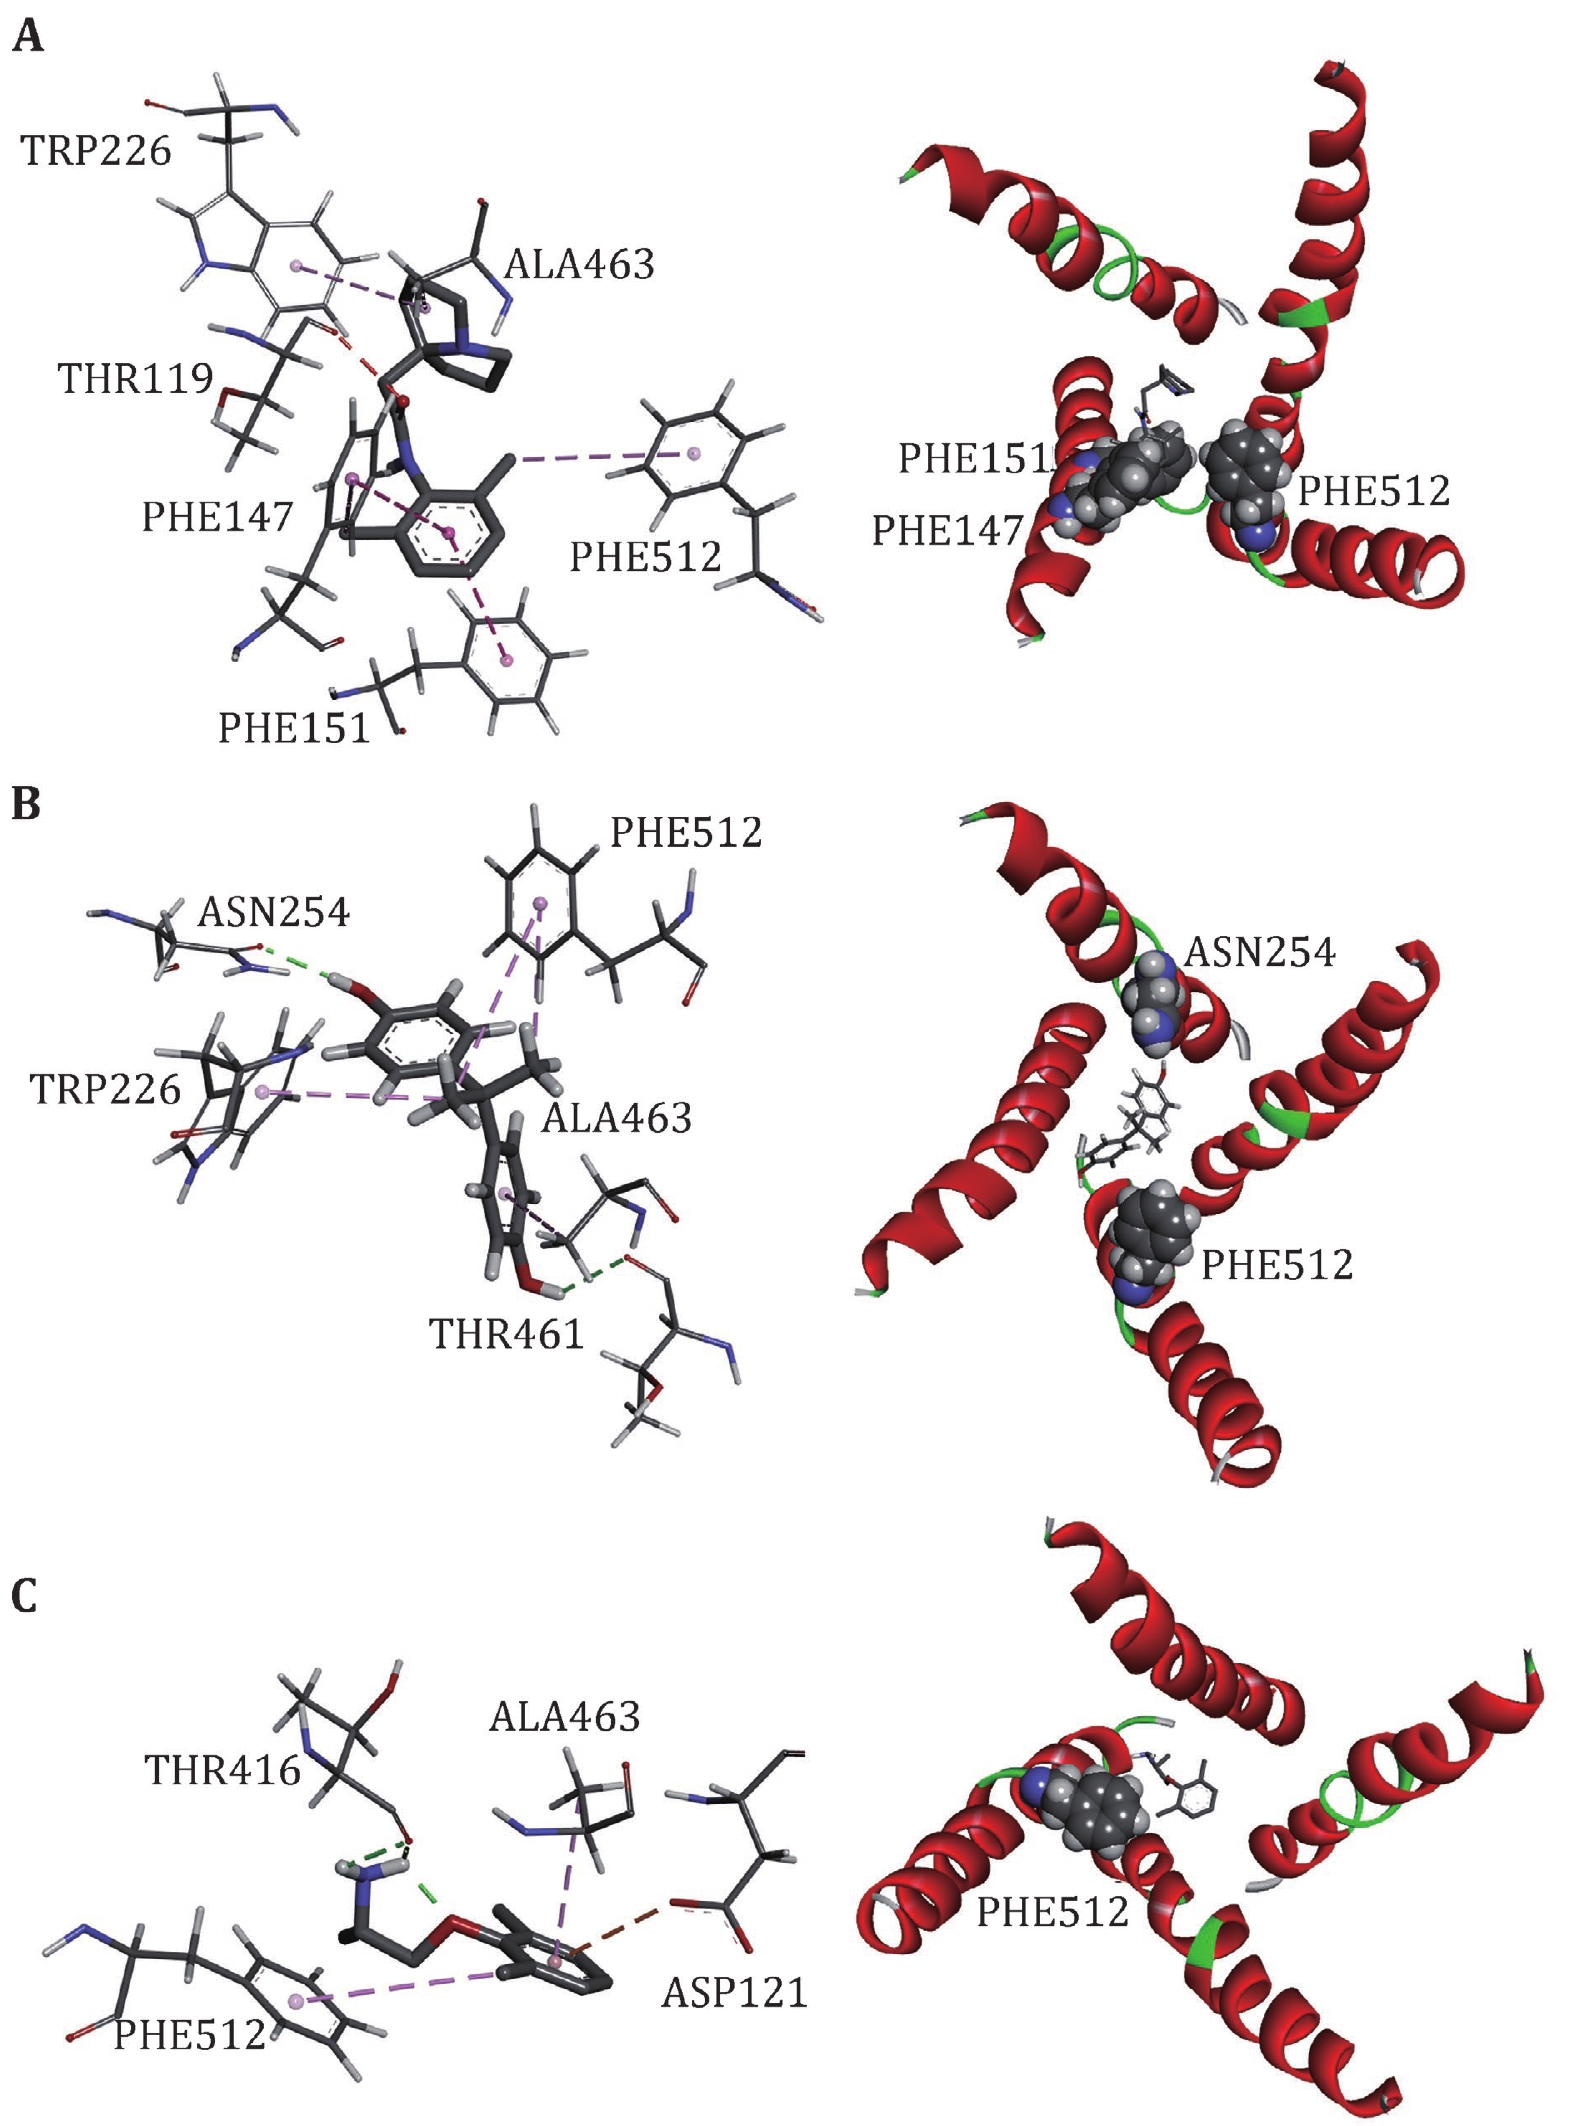
Figure 7. Interactions between Nav1.5 PD and LAs, Pilsicainide (A), Bisphenol A (B) and Mexiletine (C). The interaction diagrams (left column) were calculated and all of the structures were generated by using Discovery Studio client (version 4.1). S6s in four domains (right column) are shown in cartoon and the binding sites are shown in sphere, colored by spectrum
-
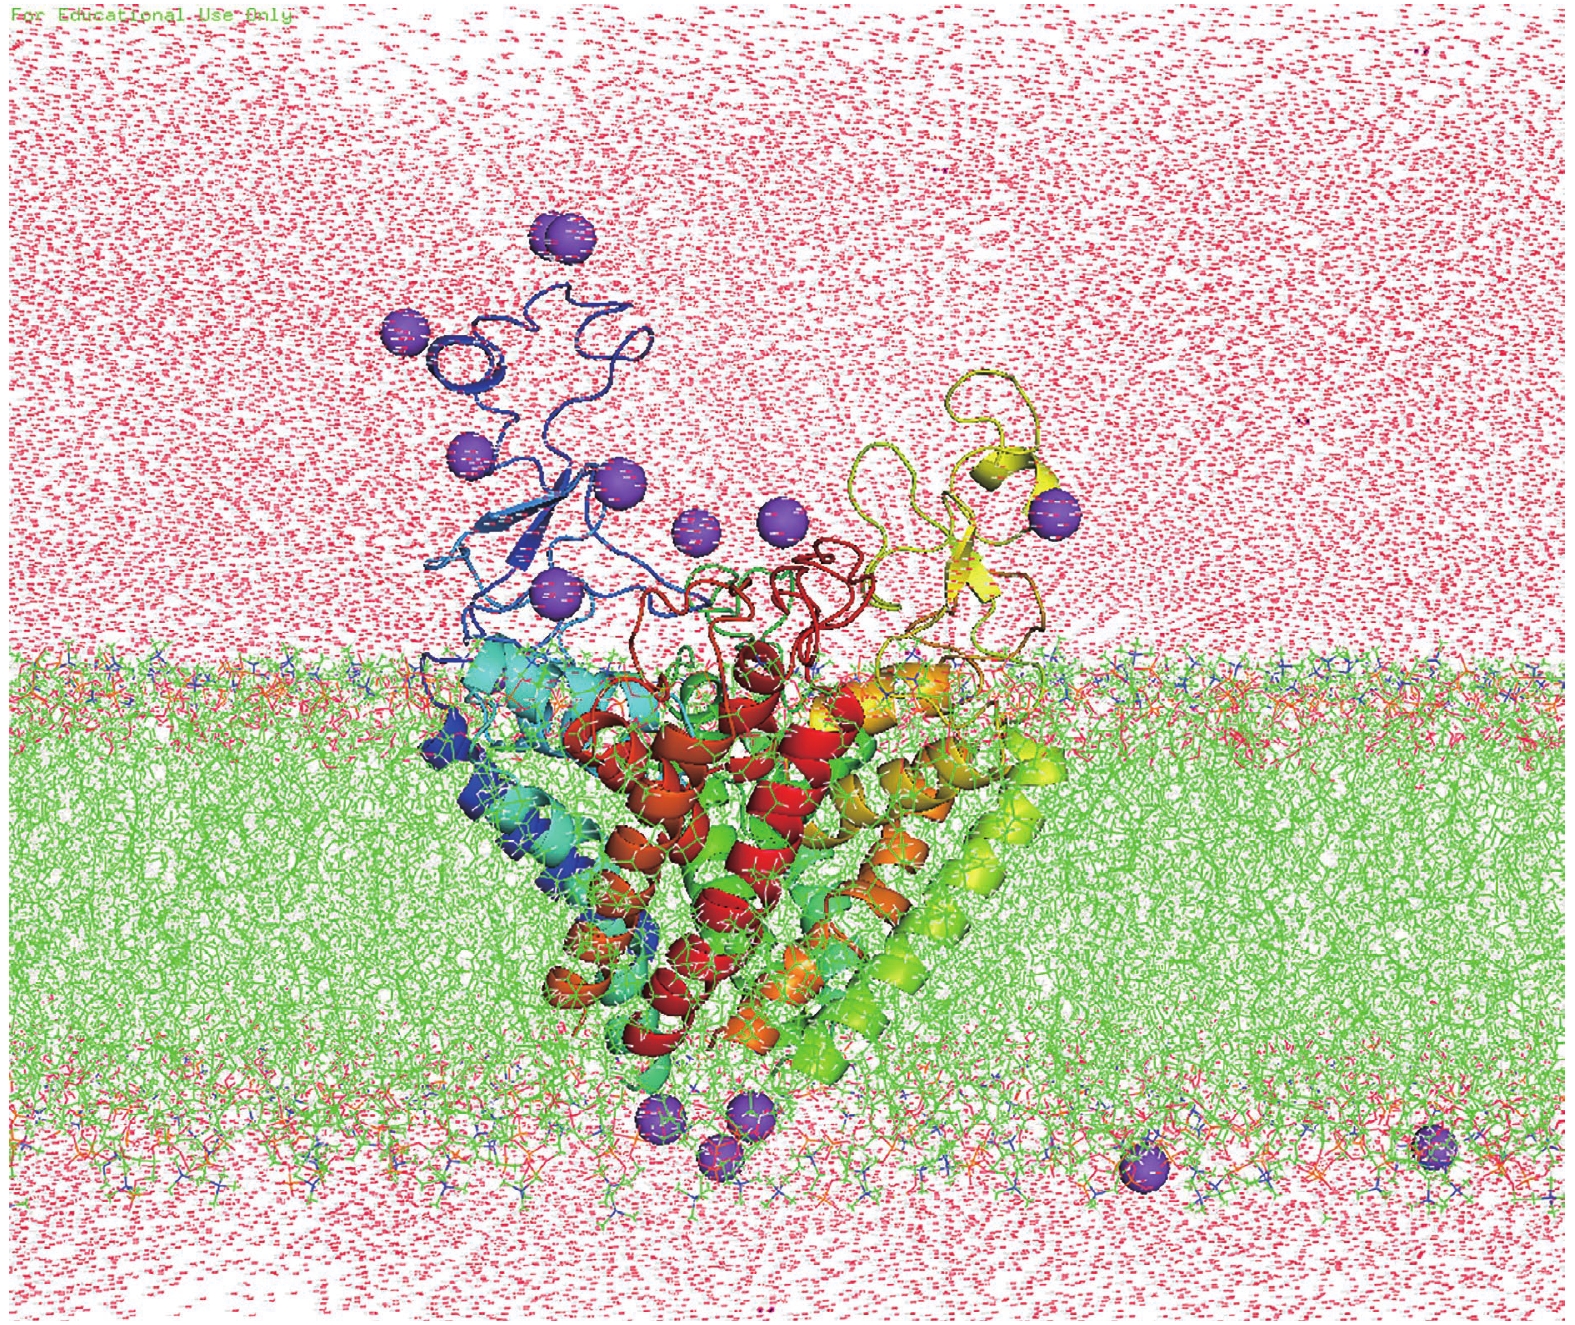
Figure 8. System used for MD simulations of Nav1.5 PD. Nav1.5 PD (in spectrum cartoon) embedded in a POPC lipid bilayer (in green stick). Sodium ions are purple
Figure
8 ,Table
6 个