-
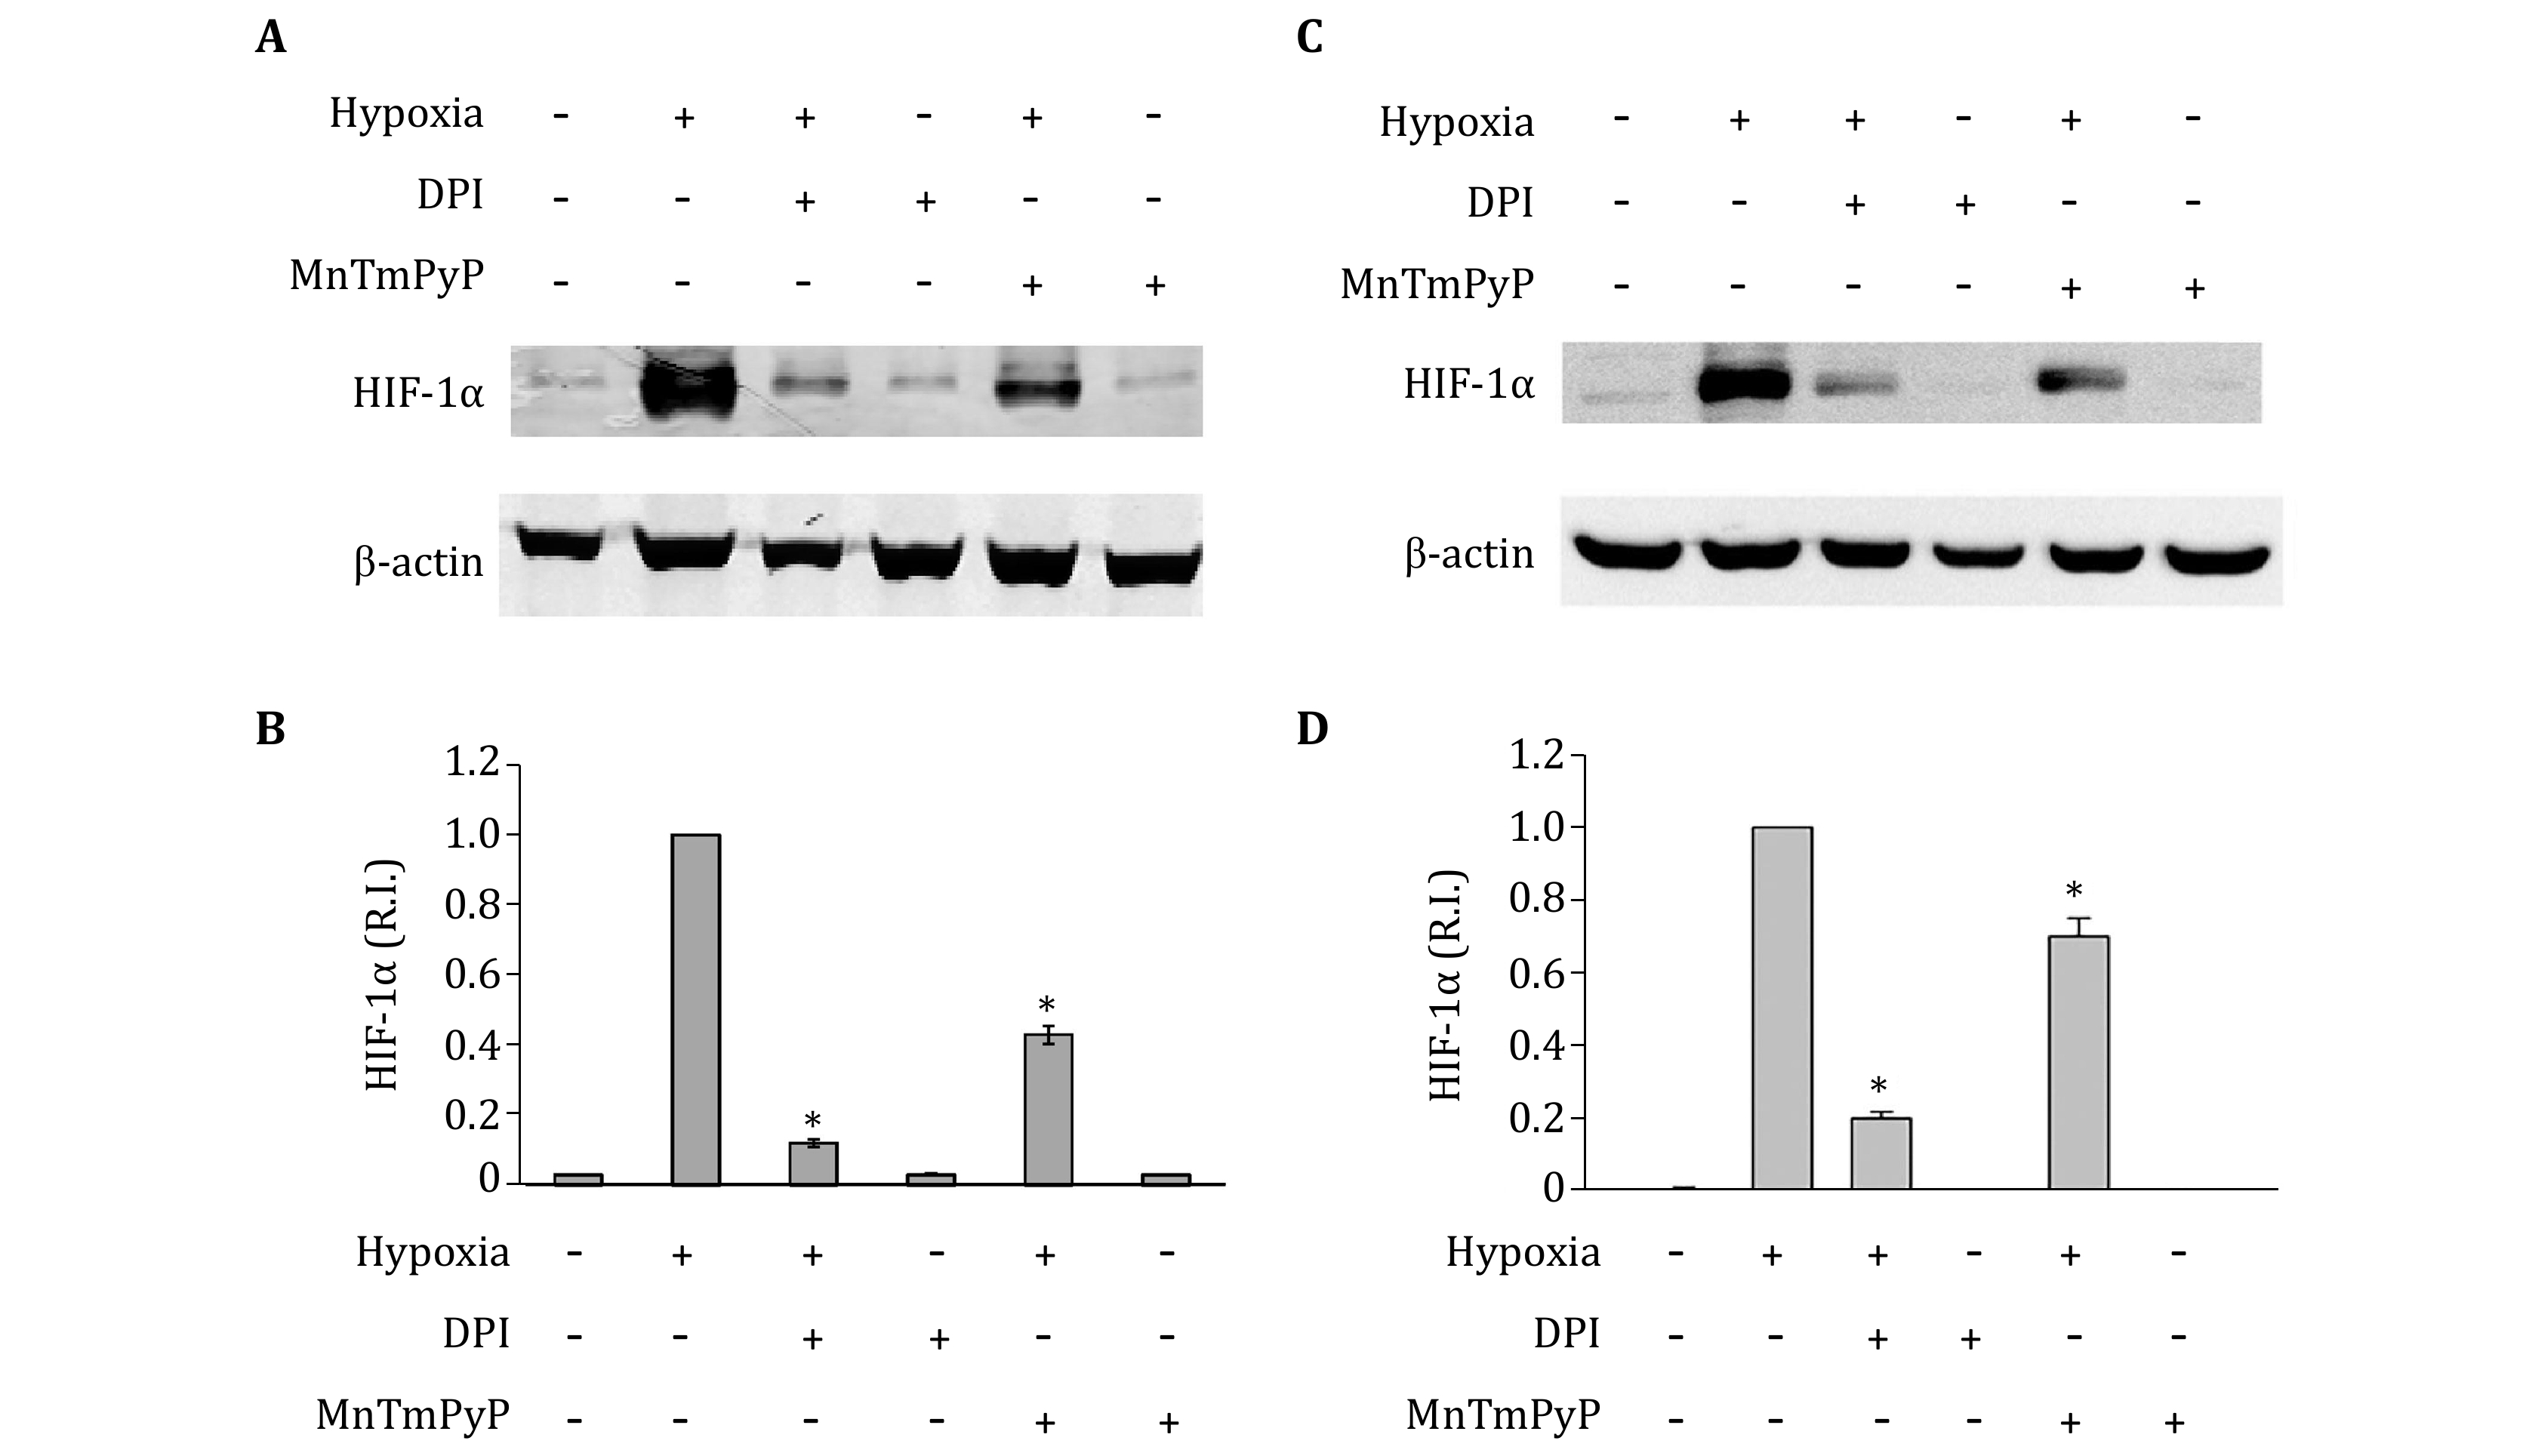
Figure 1. Effects of DPI and MnTMPyP on the expression of HIF-1alpha in primary astrocytes (A, B) and C8-D1A cells (C, D). A, C A representative Western blot. B, D Quantitative data of HIF-1alpha protein levels. Primary astrocytes or C8-D1A cells were exposed to normoxia or hypoxia for two hours after 20 min pretreatment with 30 μmol/L DPI or 5 μmol/L MnTMPyP. The protein band intensity was quantitated and normalized to the hypoxia group (R.I.: relative intensity). Data were expressed as mean ± SEM (n = 3). *p < 0.05 compared with the hypoxia group
-
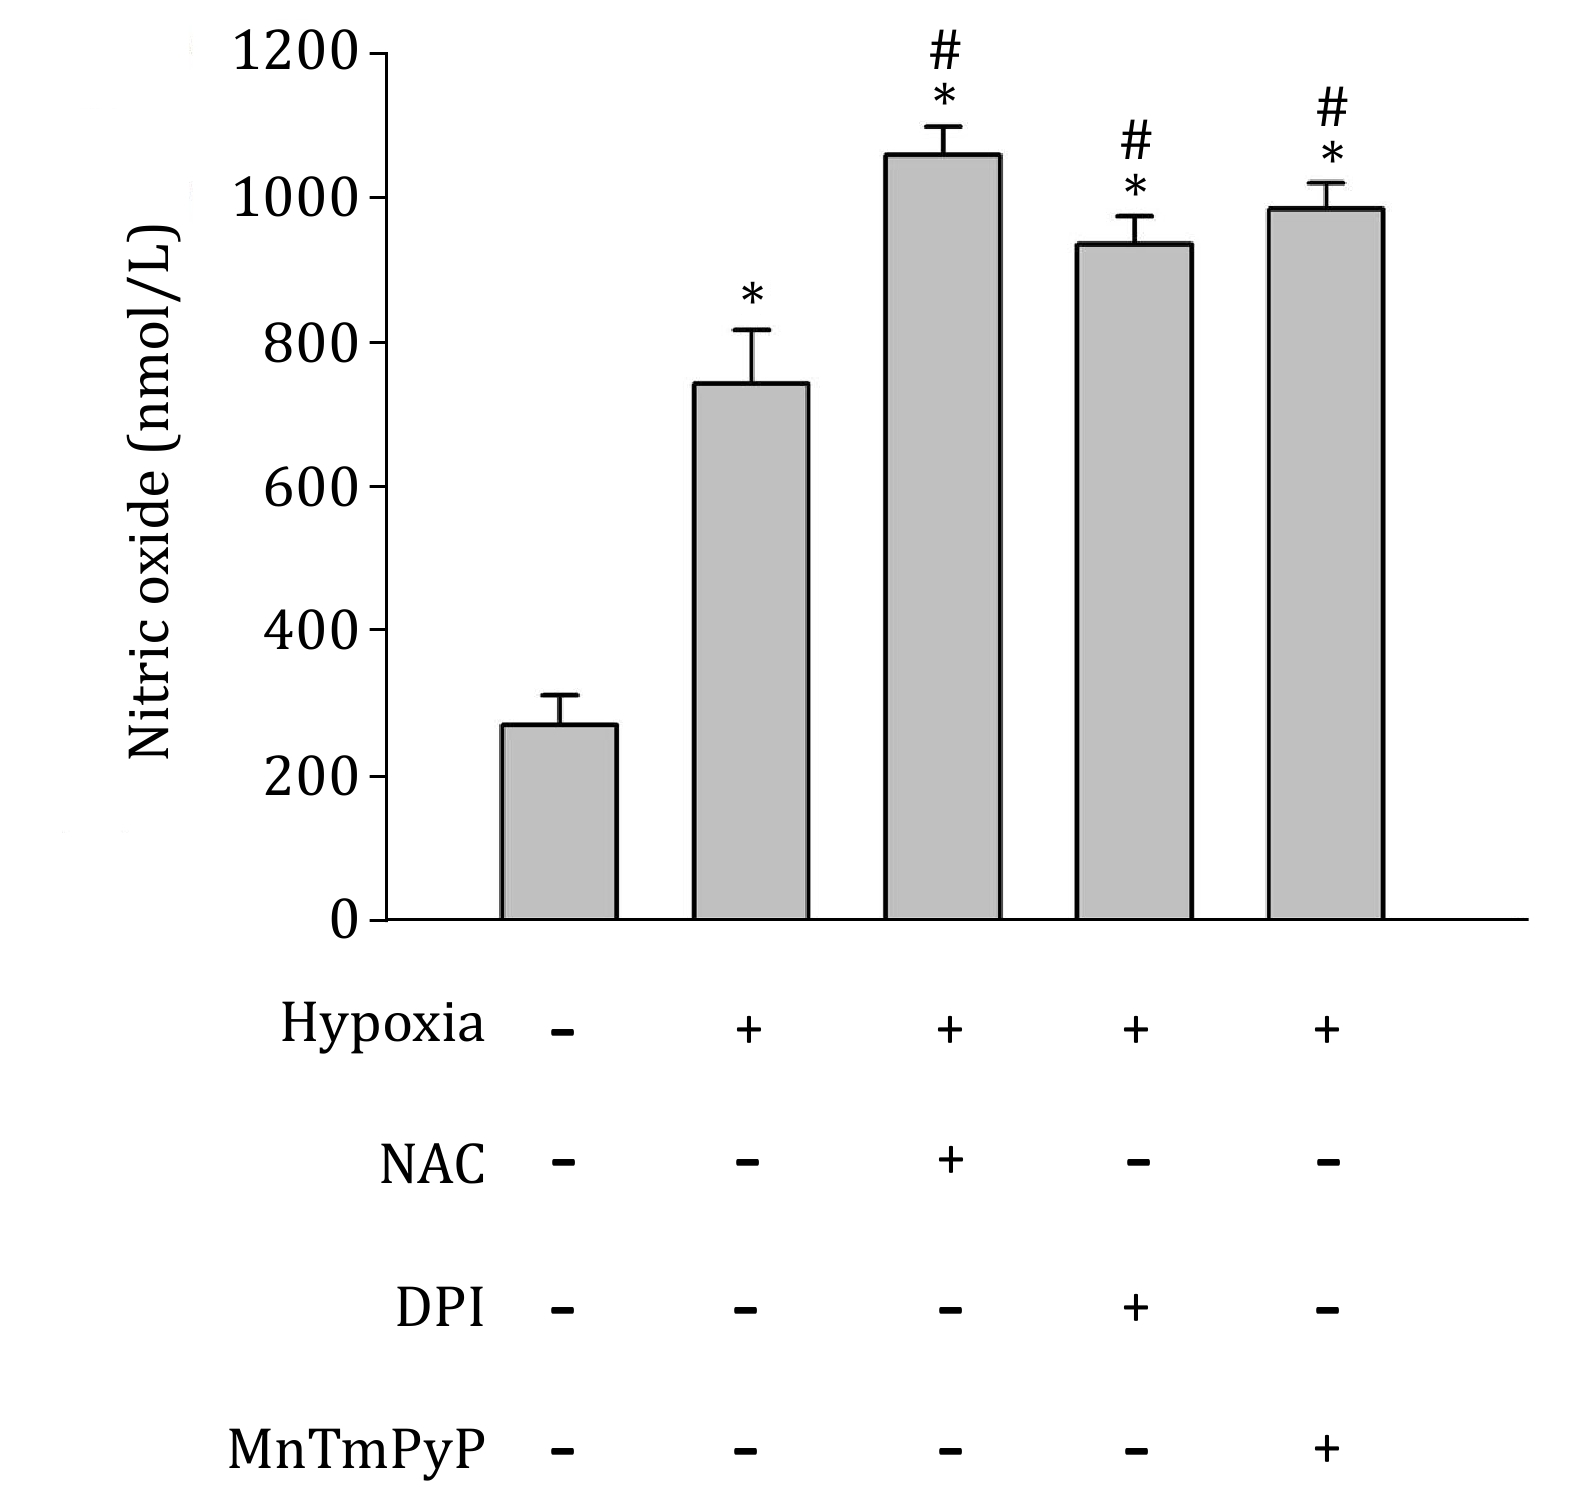
Figure 2. Effects of DPI, MnTMPyP and NAC on hypoxia-induced NO production. C8-D1A cells were exposed to normoxia or hypoxia for two hours after 20 min pretreatment with or without the indicated ROS inhibitor or scavenger. Hypoxia increased NO generation, which was further increased in the presence of NAC (1 mmol/L), DPI (30 μmol/L) or MnTMPyP (5 μmol/L). Data were expressed as mean ± SEM (n = 3). *p < 0.05 compared with normoxia group; #p < 0.05 compared with hypoxia group
-
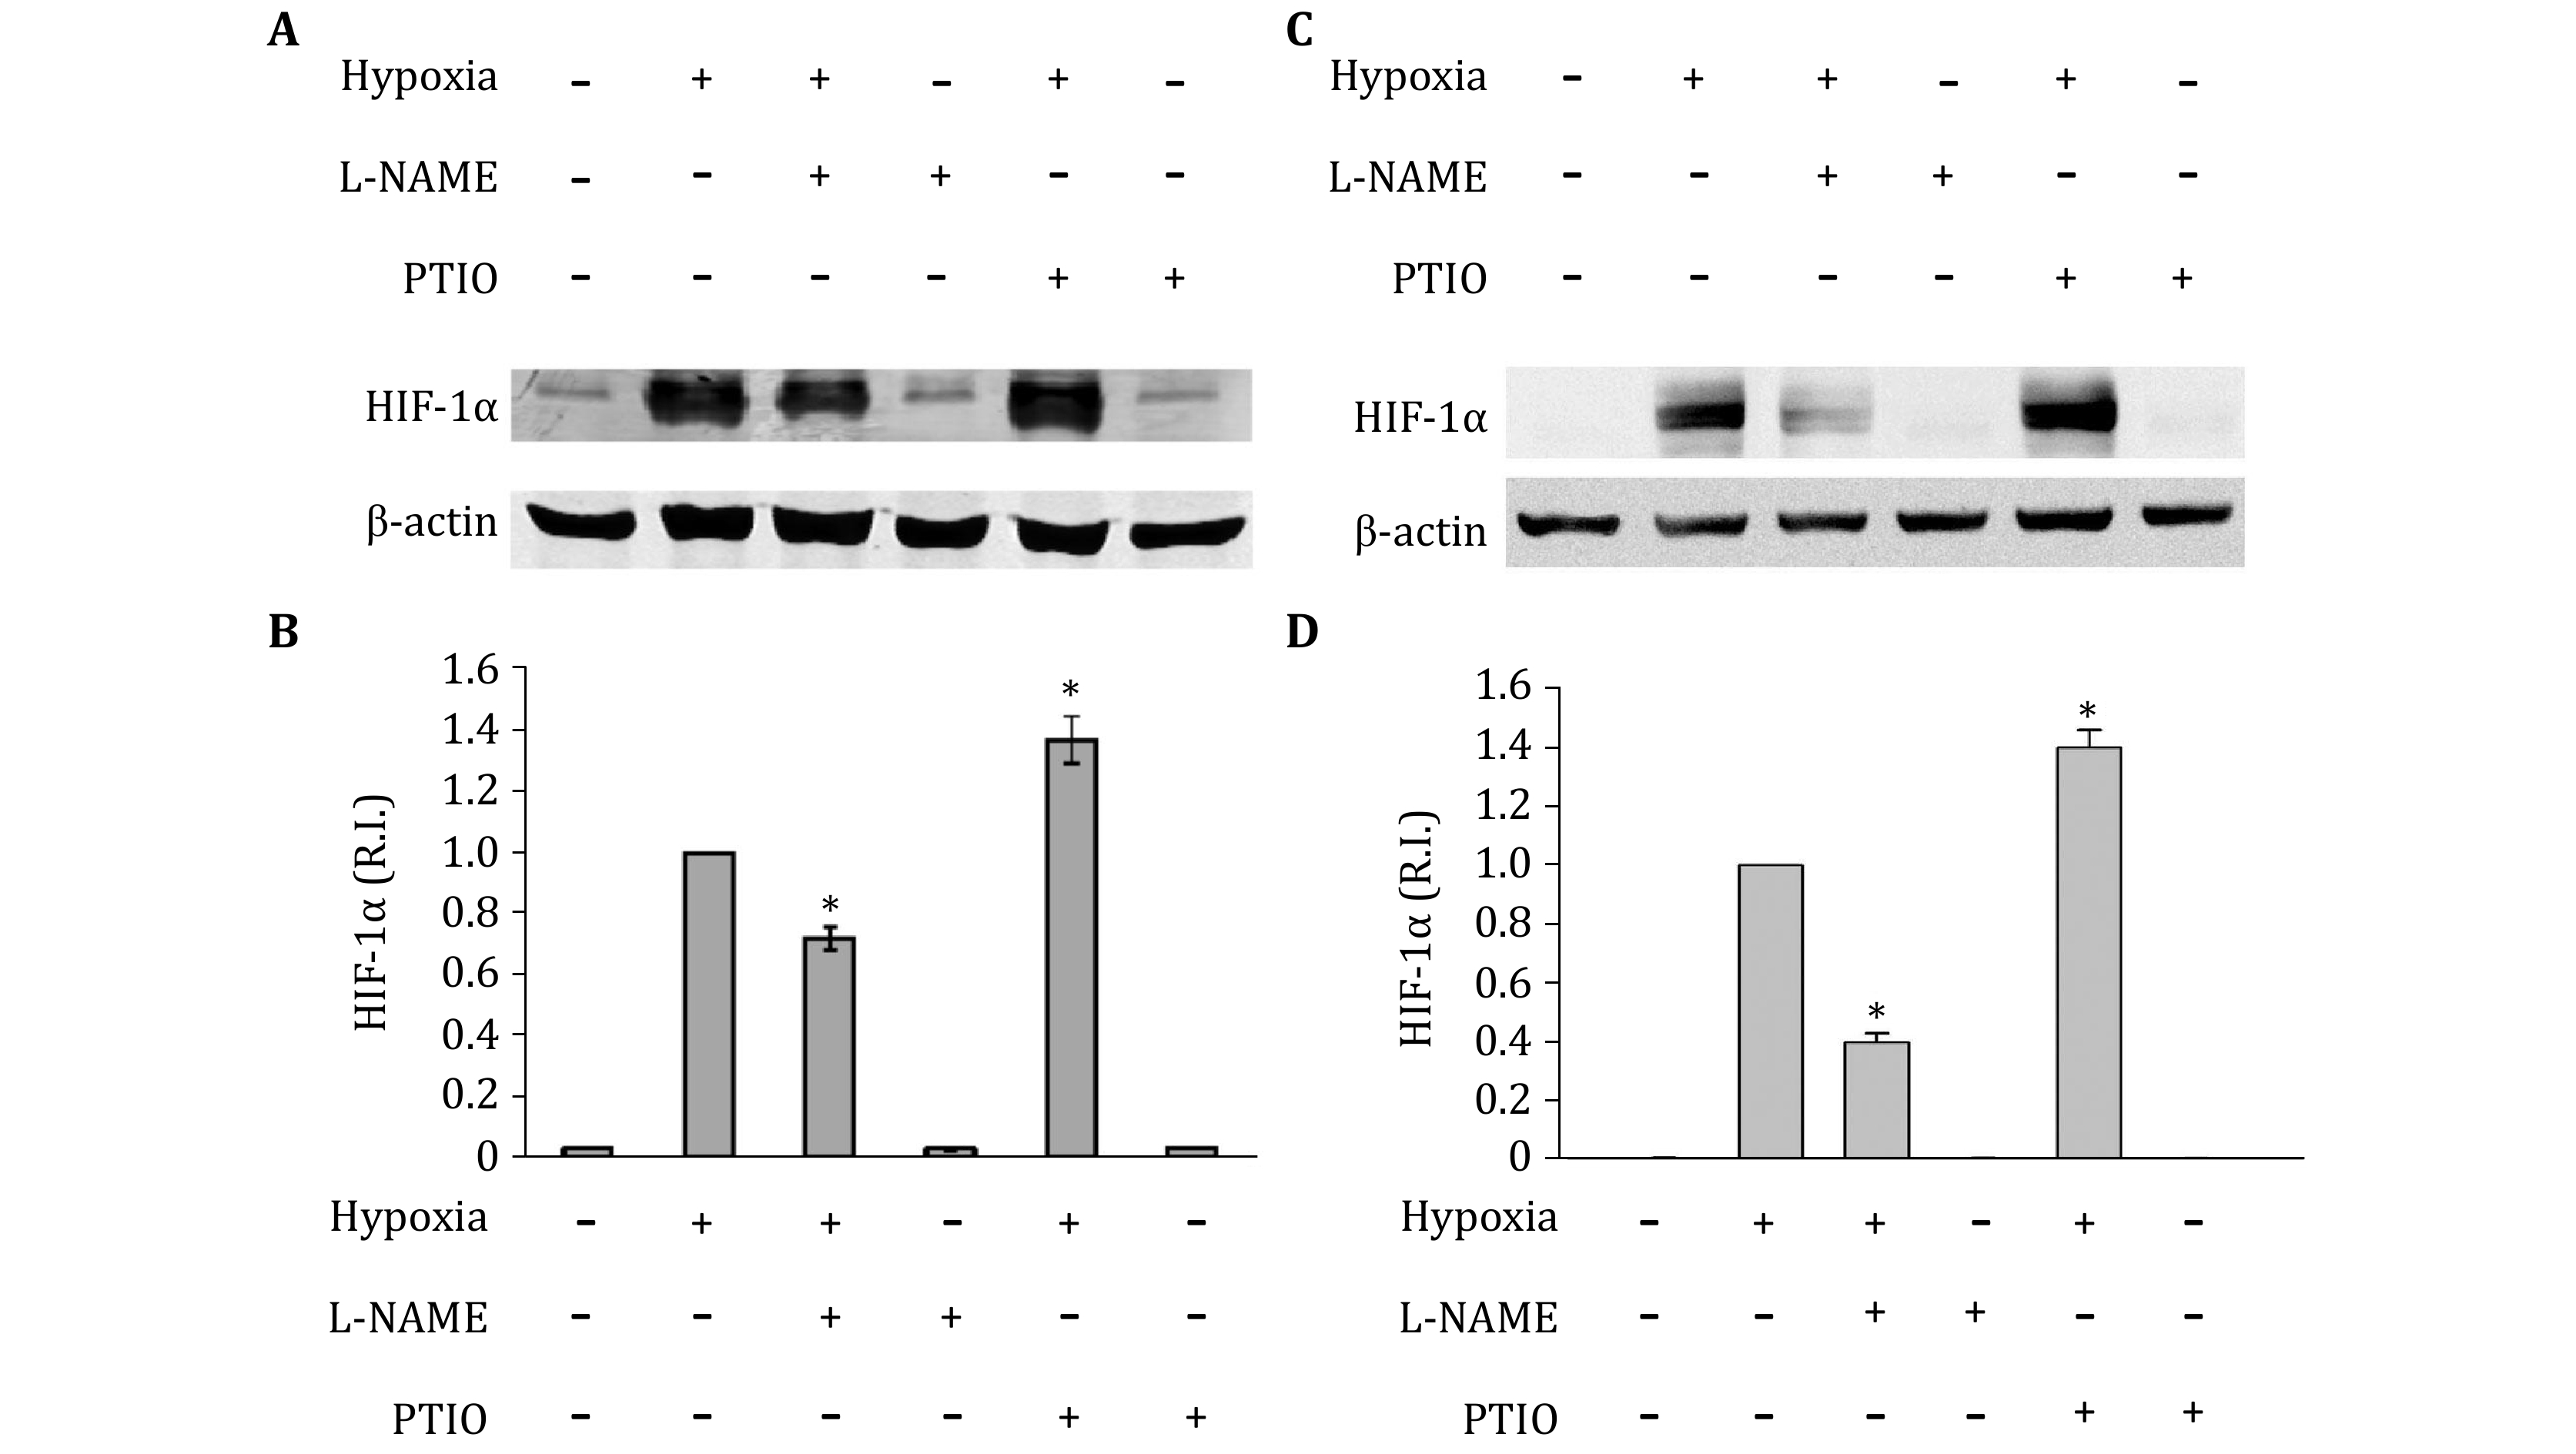
Figure 3. Effects of L-NAME and PTIO on the expression of HIF-1alpha in primary astrocytes (A, B) and C8-D1A cells (C, D). A, C A representative Western blot. B, D Quantitative data of HIF-1alpha protein levels. Primary astrocytes or C8-D1A cells were exposed to normoxia or hypoxia for two hours after 20 min pretreatment with 1 mmol/L L-NAME or 100 μmol/L PTIO. The protein band intensity was quantitated and normalized to the hypoxia group (R.I.: relative intensity). Data were expressed as mean ± SEM (n = 3). *p < 0.05 compared with the hypoxia group
-
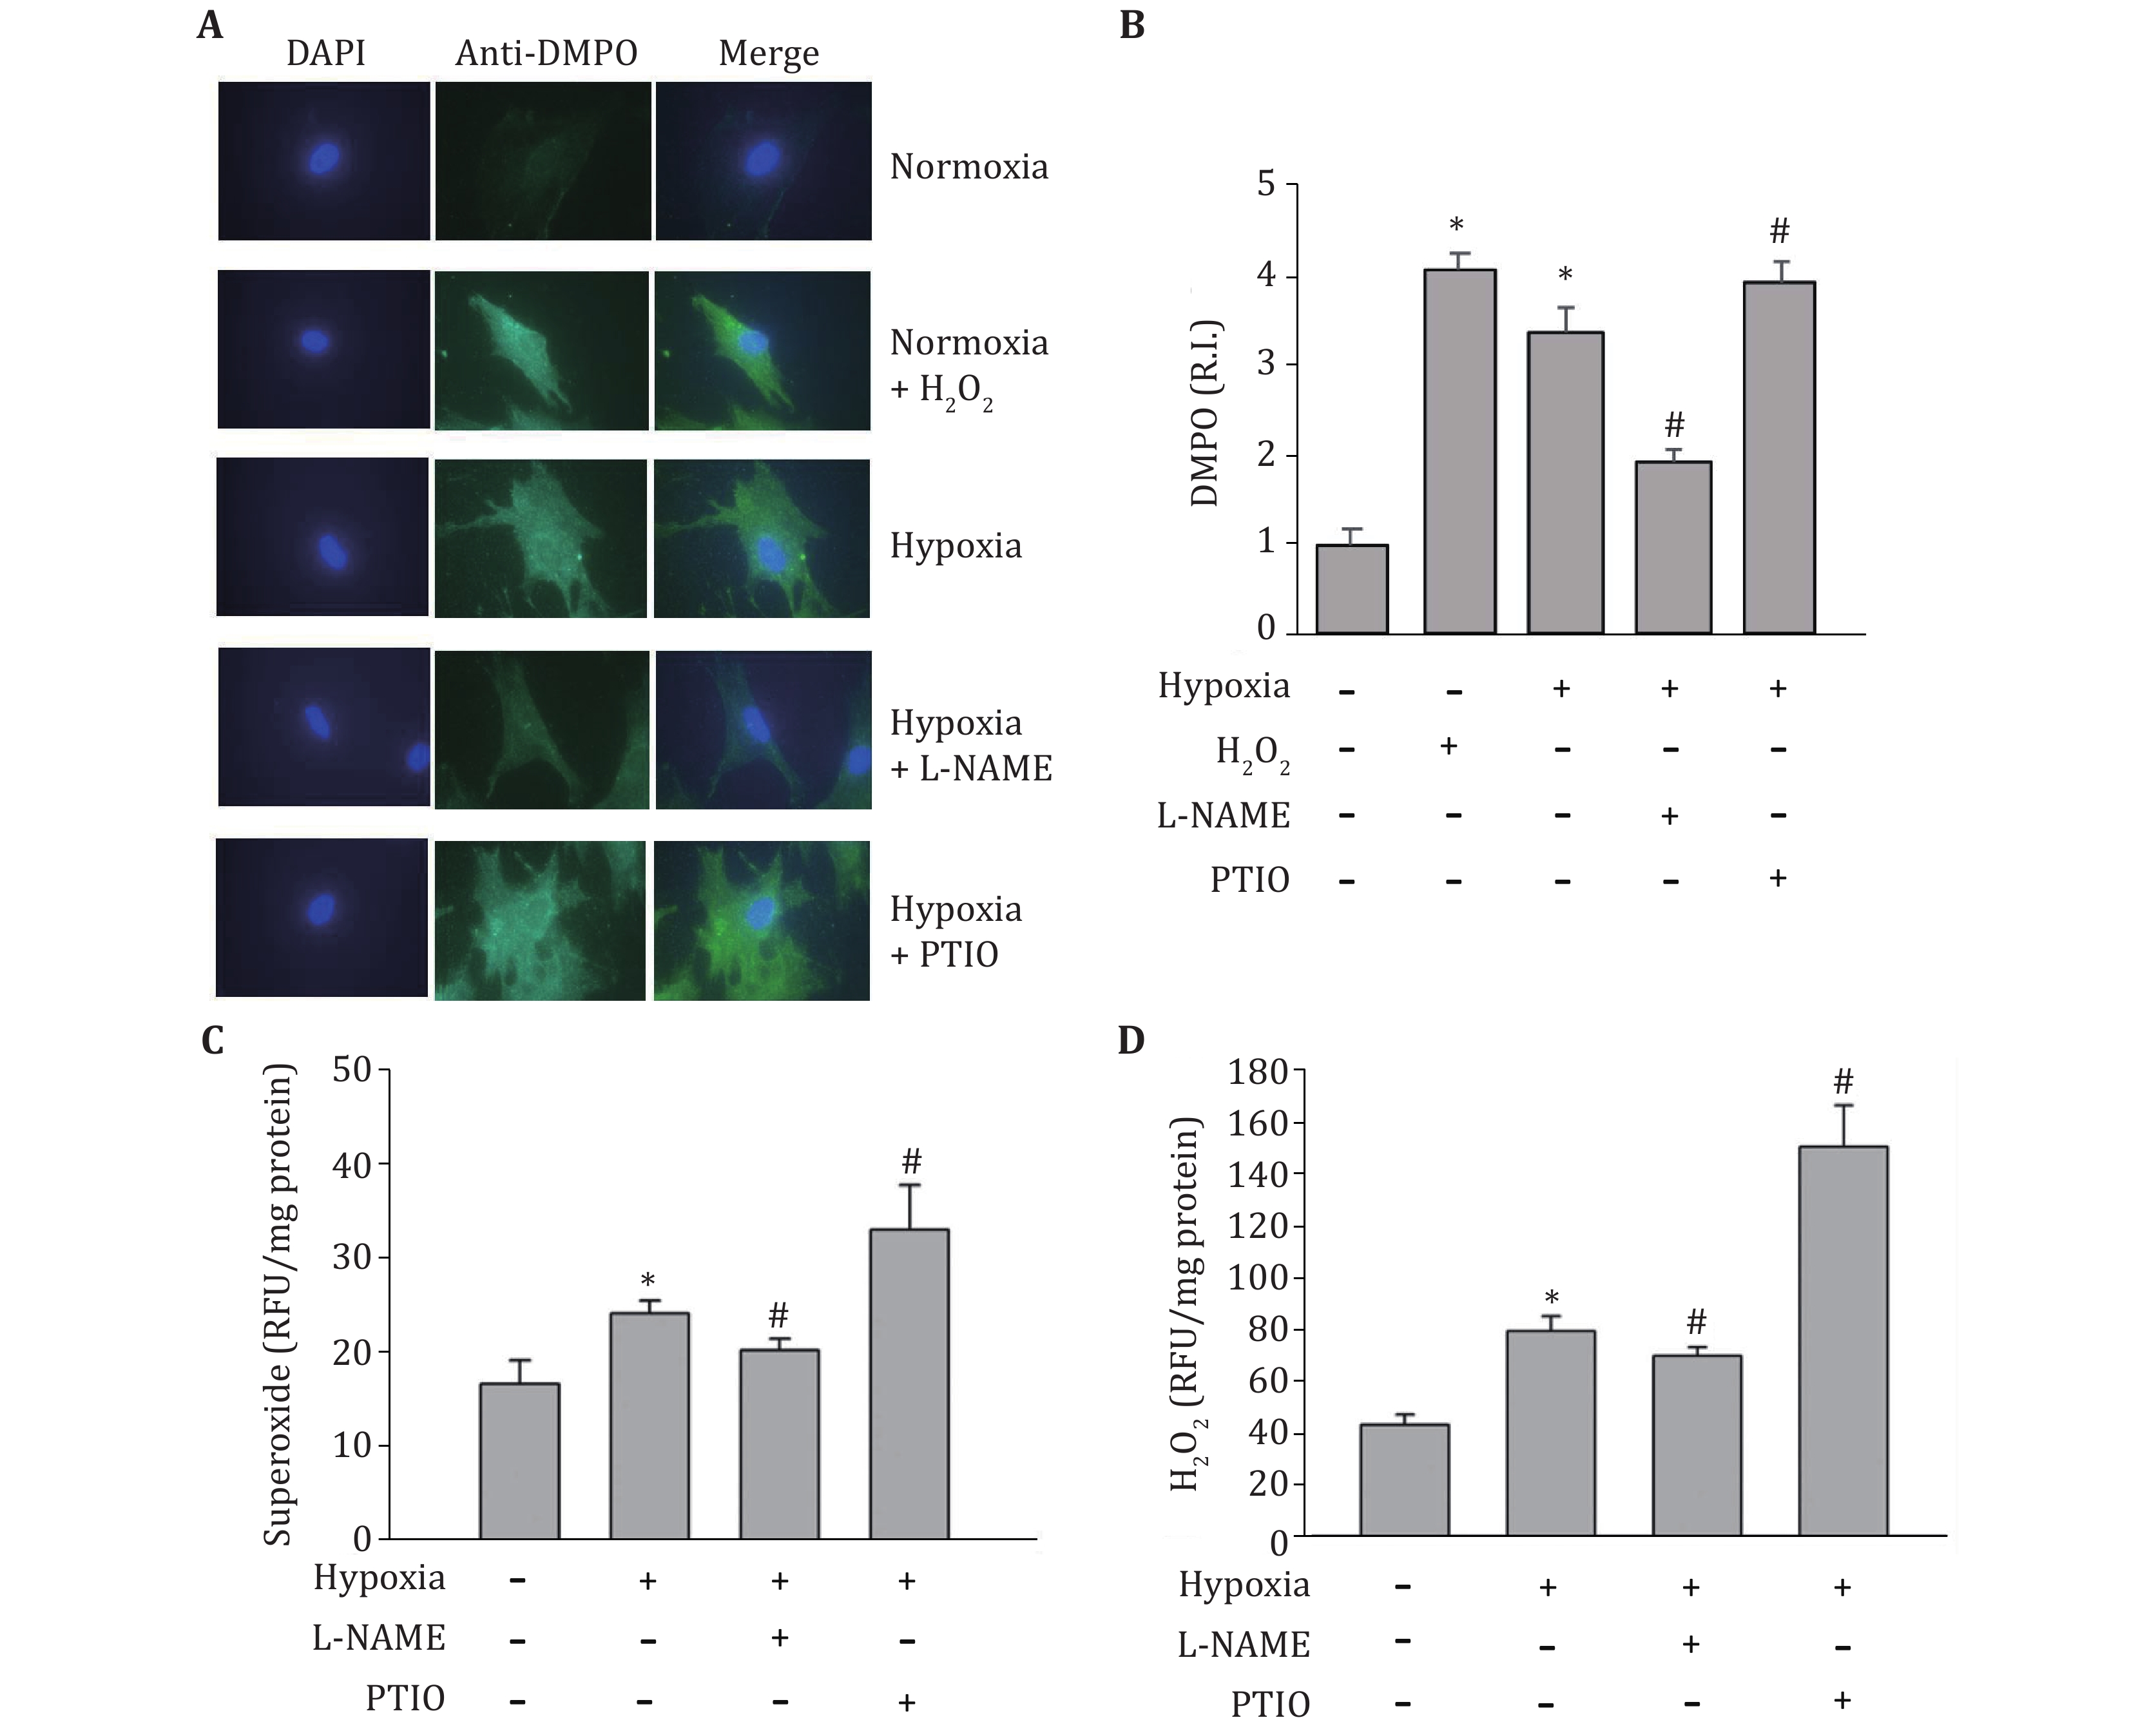
Figure 4. Effects of L-NAME and PTIO on hypoxia induced ROS production. At the end of the indicated treatments, protein-derived superoxide was measured by immuno-spin trapping (A). H2O2 was used as positive control in immune-spin trapping. The relative intensity (R.I.) of DMPO signal was quantitated and normalized to the normoxia group (B). The intracellular superoxide was measured by DHE staining (C), while hydrogen peroxide levels were measured by DCFH-DA staining (D) as described in the method section. Values of the relative fluorescence unit (RFU) were normalized to the protein concentrations. Data were expressed as mean ± SEM (n = 3). *p < 0.05 compared with the normoxia group; #p < 0.05 compared with hypoxia group
-
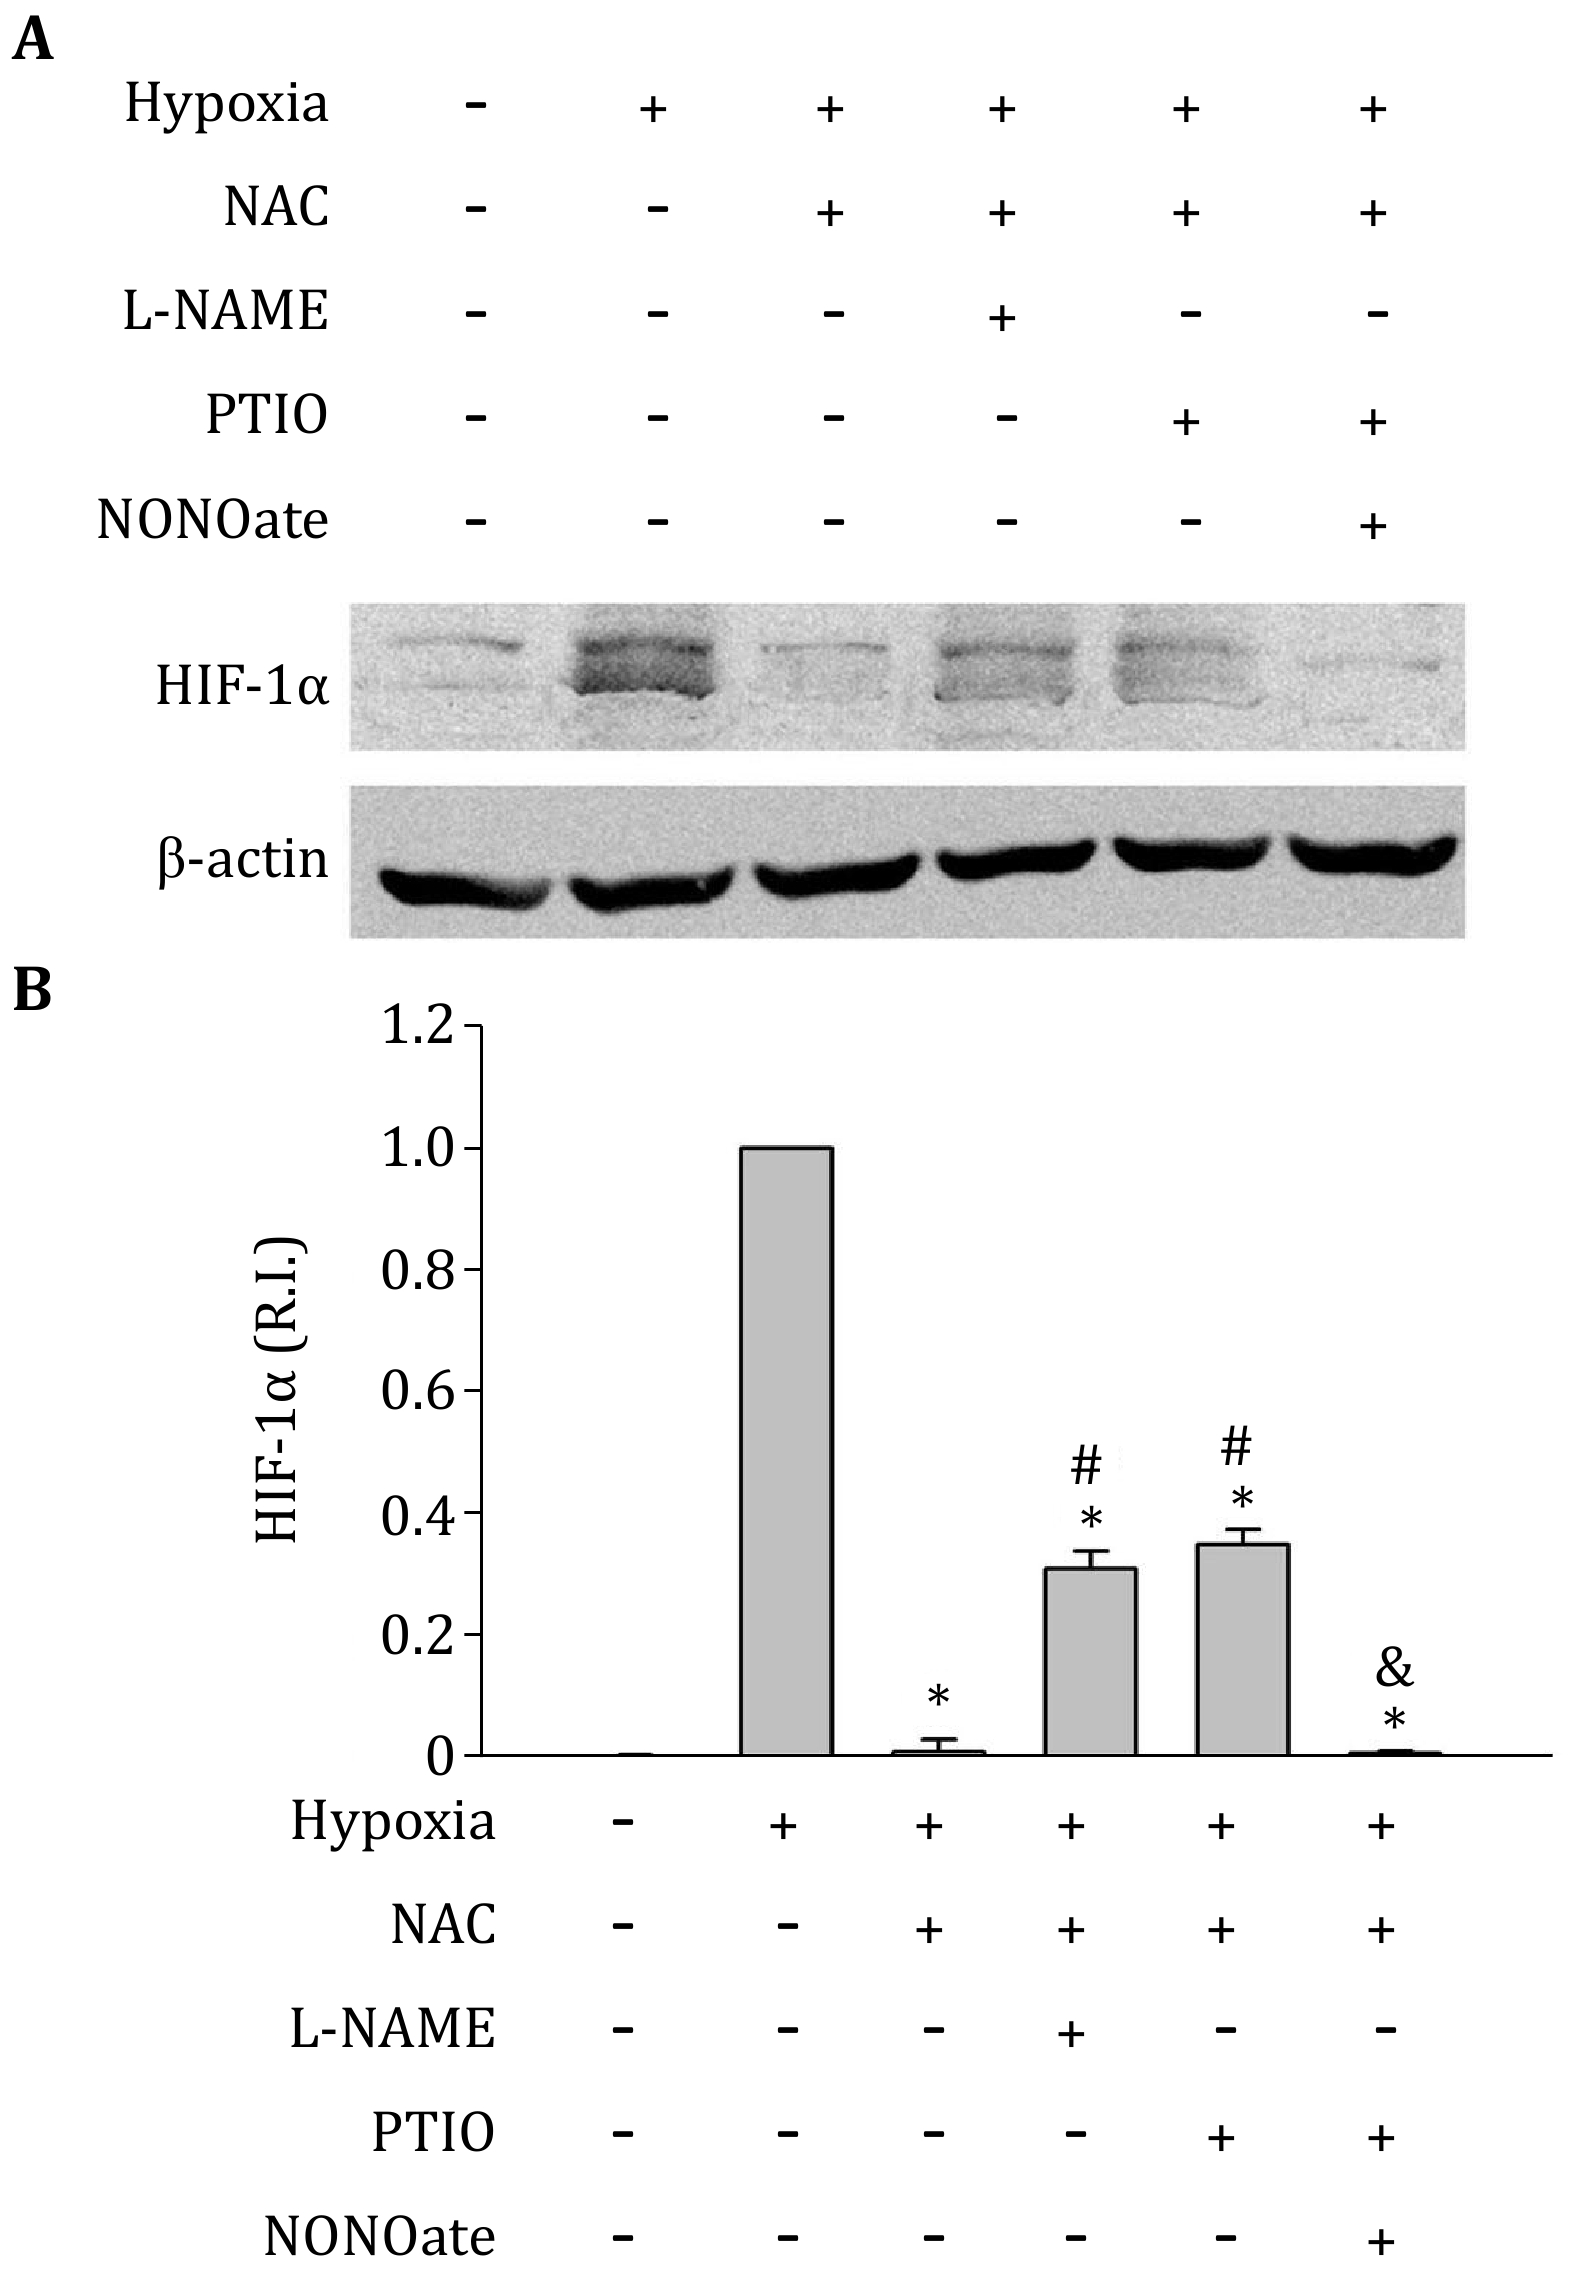
Figure 5. Effects of L-NAME and PTIO on HIF-1alpha expression in hypoxic C8-D1A cells pretreated with NAC. A A representative Western-blot. B Quantitative data of HIF-1alpha protein levels. 1 mmol/L NAC almost completely abolished the HIF-1alpha protein accumulation induced by hypoxia treatment. Both L-NAME (1 mmol/L) and PTIO (100 μmol/L) increased HIF-1alpha protein levels compared to the hypoxia + NAC group. The protein band intensity was quantitated and normalized to the hypoxia group (R.I.: relative intensity). Results were expressed as mean ± SEM (n = 3). *p < 0.05 compared with hypoxia group; #p < 0.05 compared with hypoxia + NAC group; &p < 0.05 compared with hypoxia+NAC+PTIO group
-
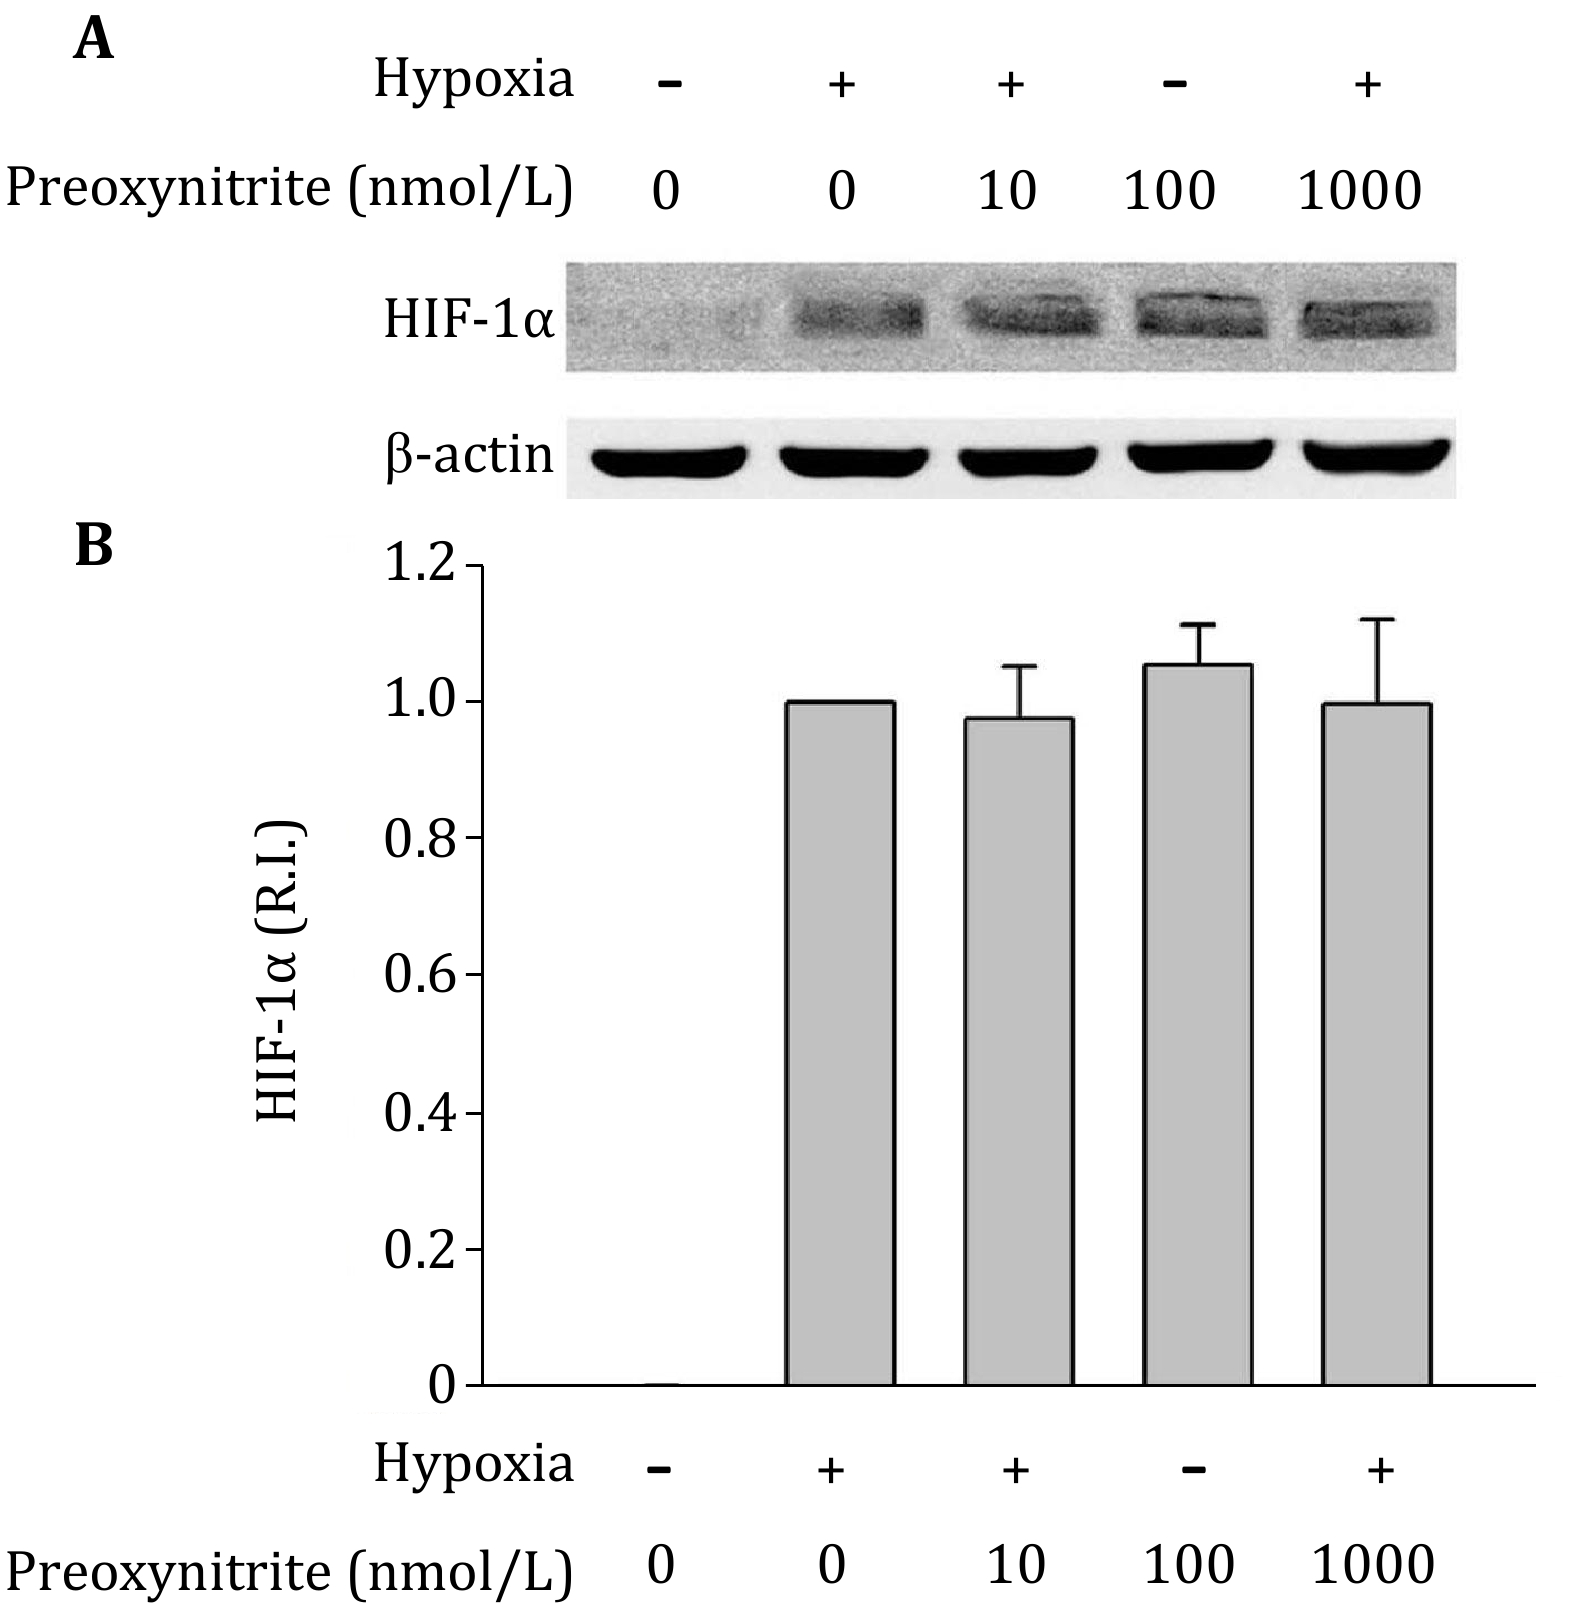
Figure 6. Effects of peroxynitrite on the expression of HIF-1alpha. A A representative western-blot. B Quantitative data of HIF-1alpha protein levels. C8-D1A cells were treated with different concentrations of peroxynitrite under hypoxic conditions. The protein band intensity was quantitated and normalized to the hypoxia group (R.I.: relative intensity). Results were expressed as mean ± SEM, n = 3
Figure
6 ,Table
0 个