-
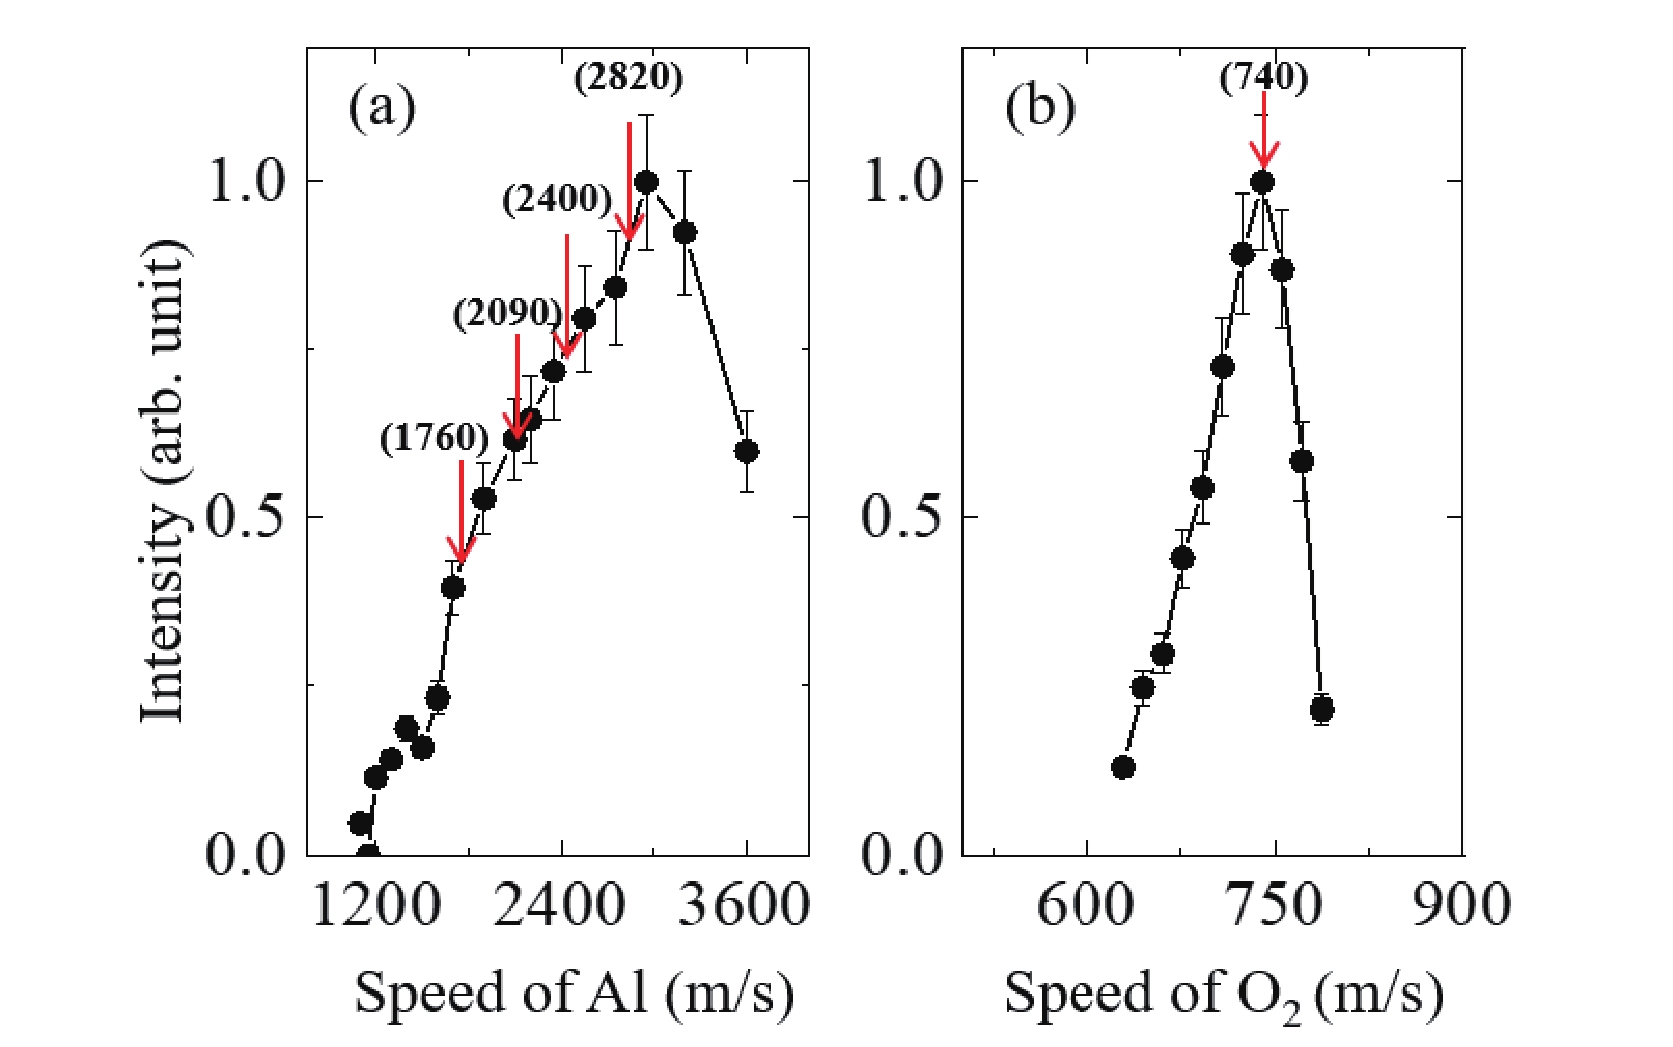
Figure 1. (a) Speed distribution of the superthermal Al beam without the use of any carrier gas, and (b) the speed distribution of pure O2 supersonic beam, determined through time-sliced ion velocity map imaging. The speeds used for the crossed-beam collision energy experiments are indicated on the graphs with red arrows.
-
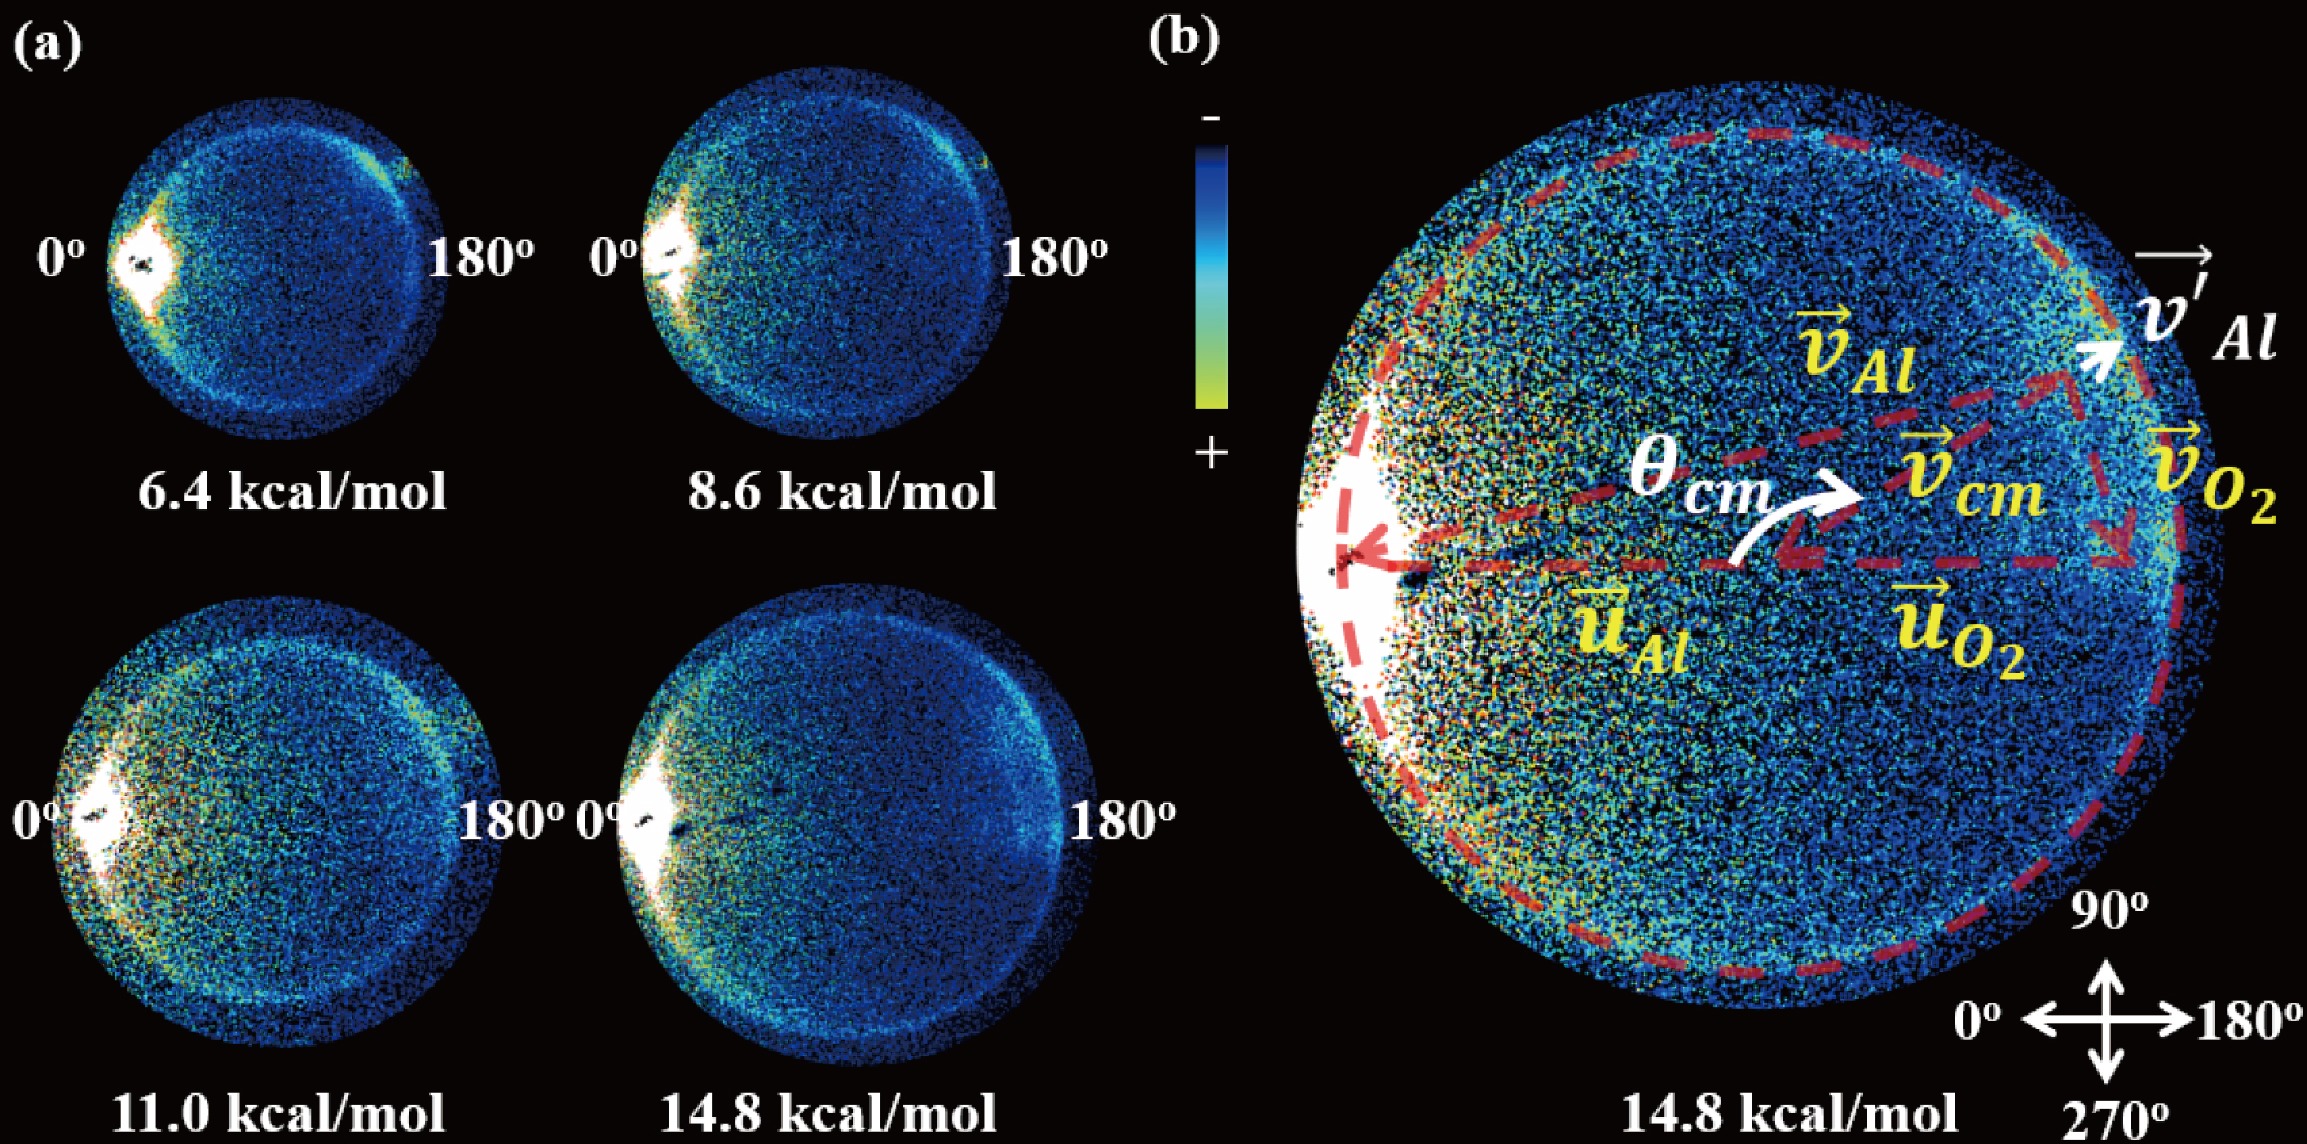
Figure 2. (a) The time-sliced ion velocity mapping images of Al(2P1/2) from Al(2P) and O2 scattering at collision energy of 6.4±0.1, 8.6±0.1, 11.0±0.1, and 14.8±0.2 kcal/mol, respectively. (b) Center-of-mass coordinate is shown in the image at 14.8±0.2 kcal/mol. The signal in the vicinity of the two-beam crossing region is significantly enhanced.
-
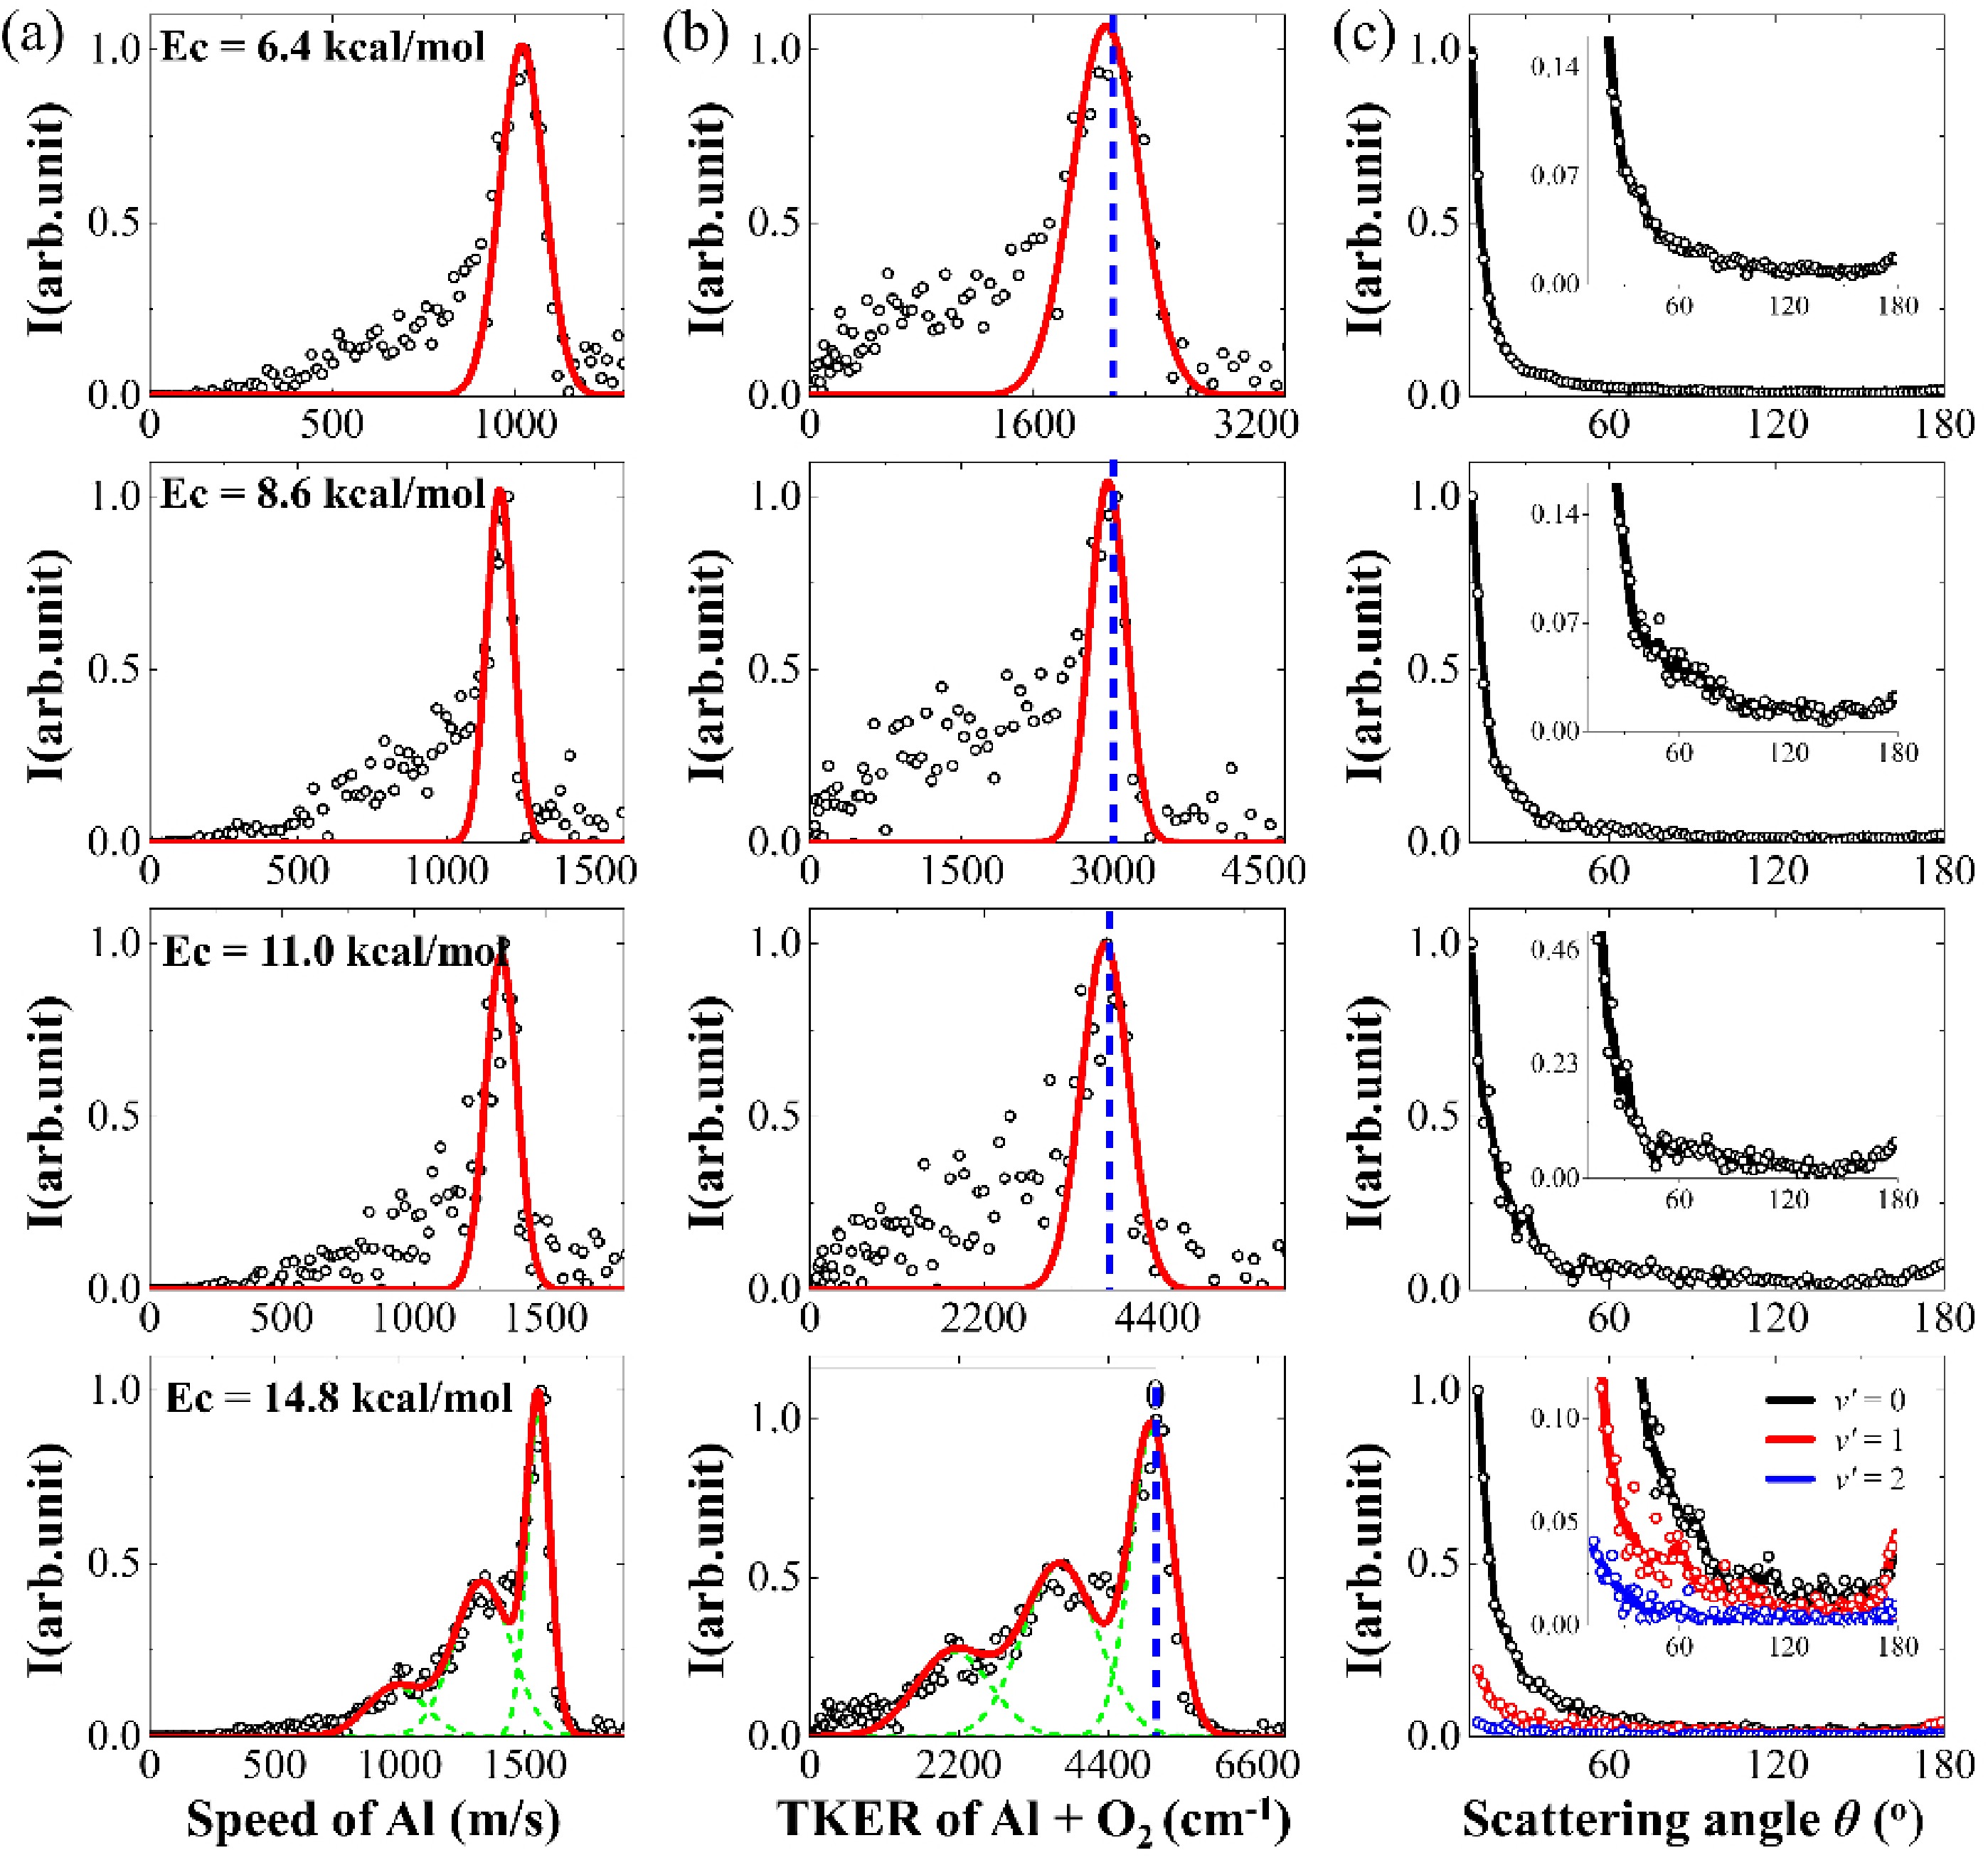
Figure 3. (a) Normalized speed distributions of Al in the center-of-mass coordinate, (b) TKER distributions of collision partners, and (c) normalized angular distributions of Al from collisions with O2 at the collision energy Ec = 6.4, 8.6, 11.0 and 14.8 kcal/mol, respectively. The vertical dashed line indicates the position of Ec. The experimental data points are represented by hollow circles, and the red lines in panels (a) and (b) are derived from Gaussian fits. The lines in panel (c) are obtained through a 15-point adjacent average.
-
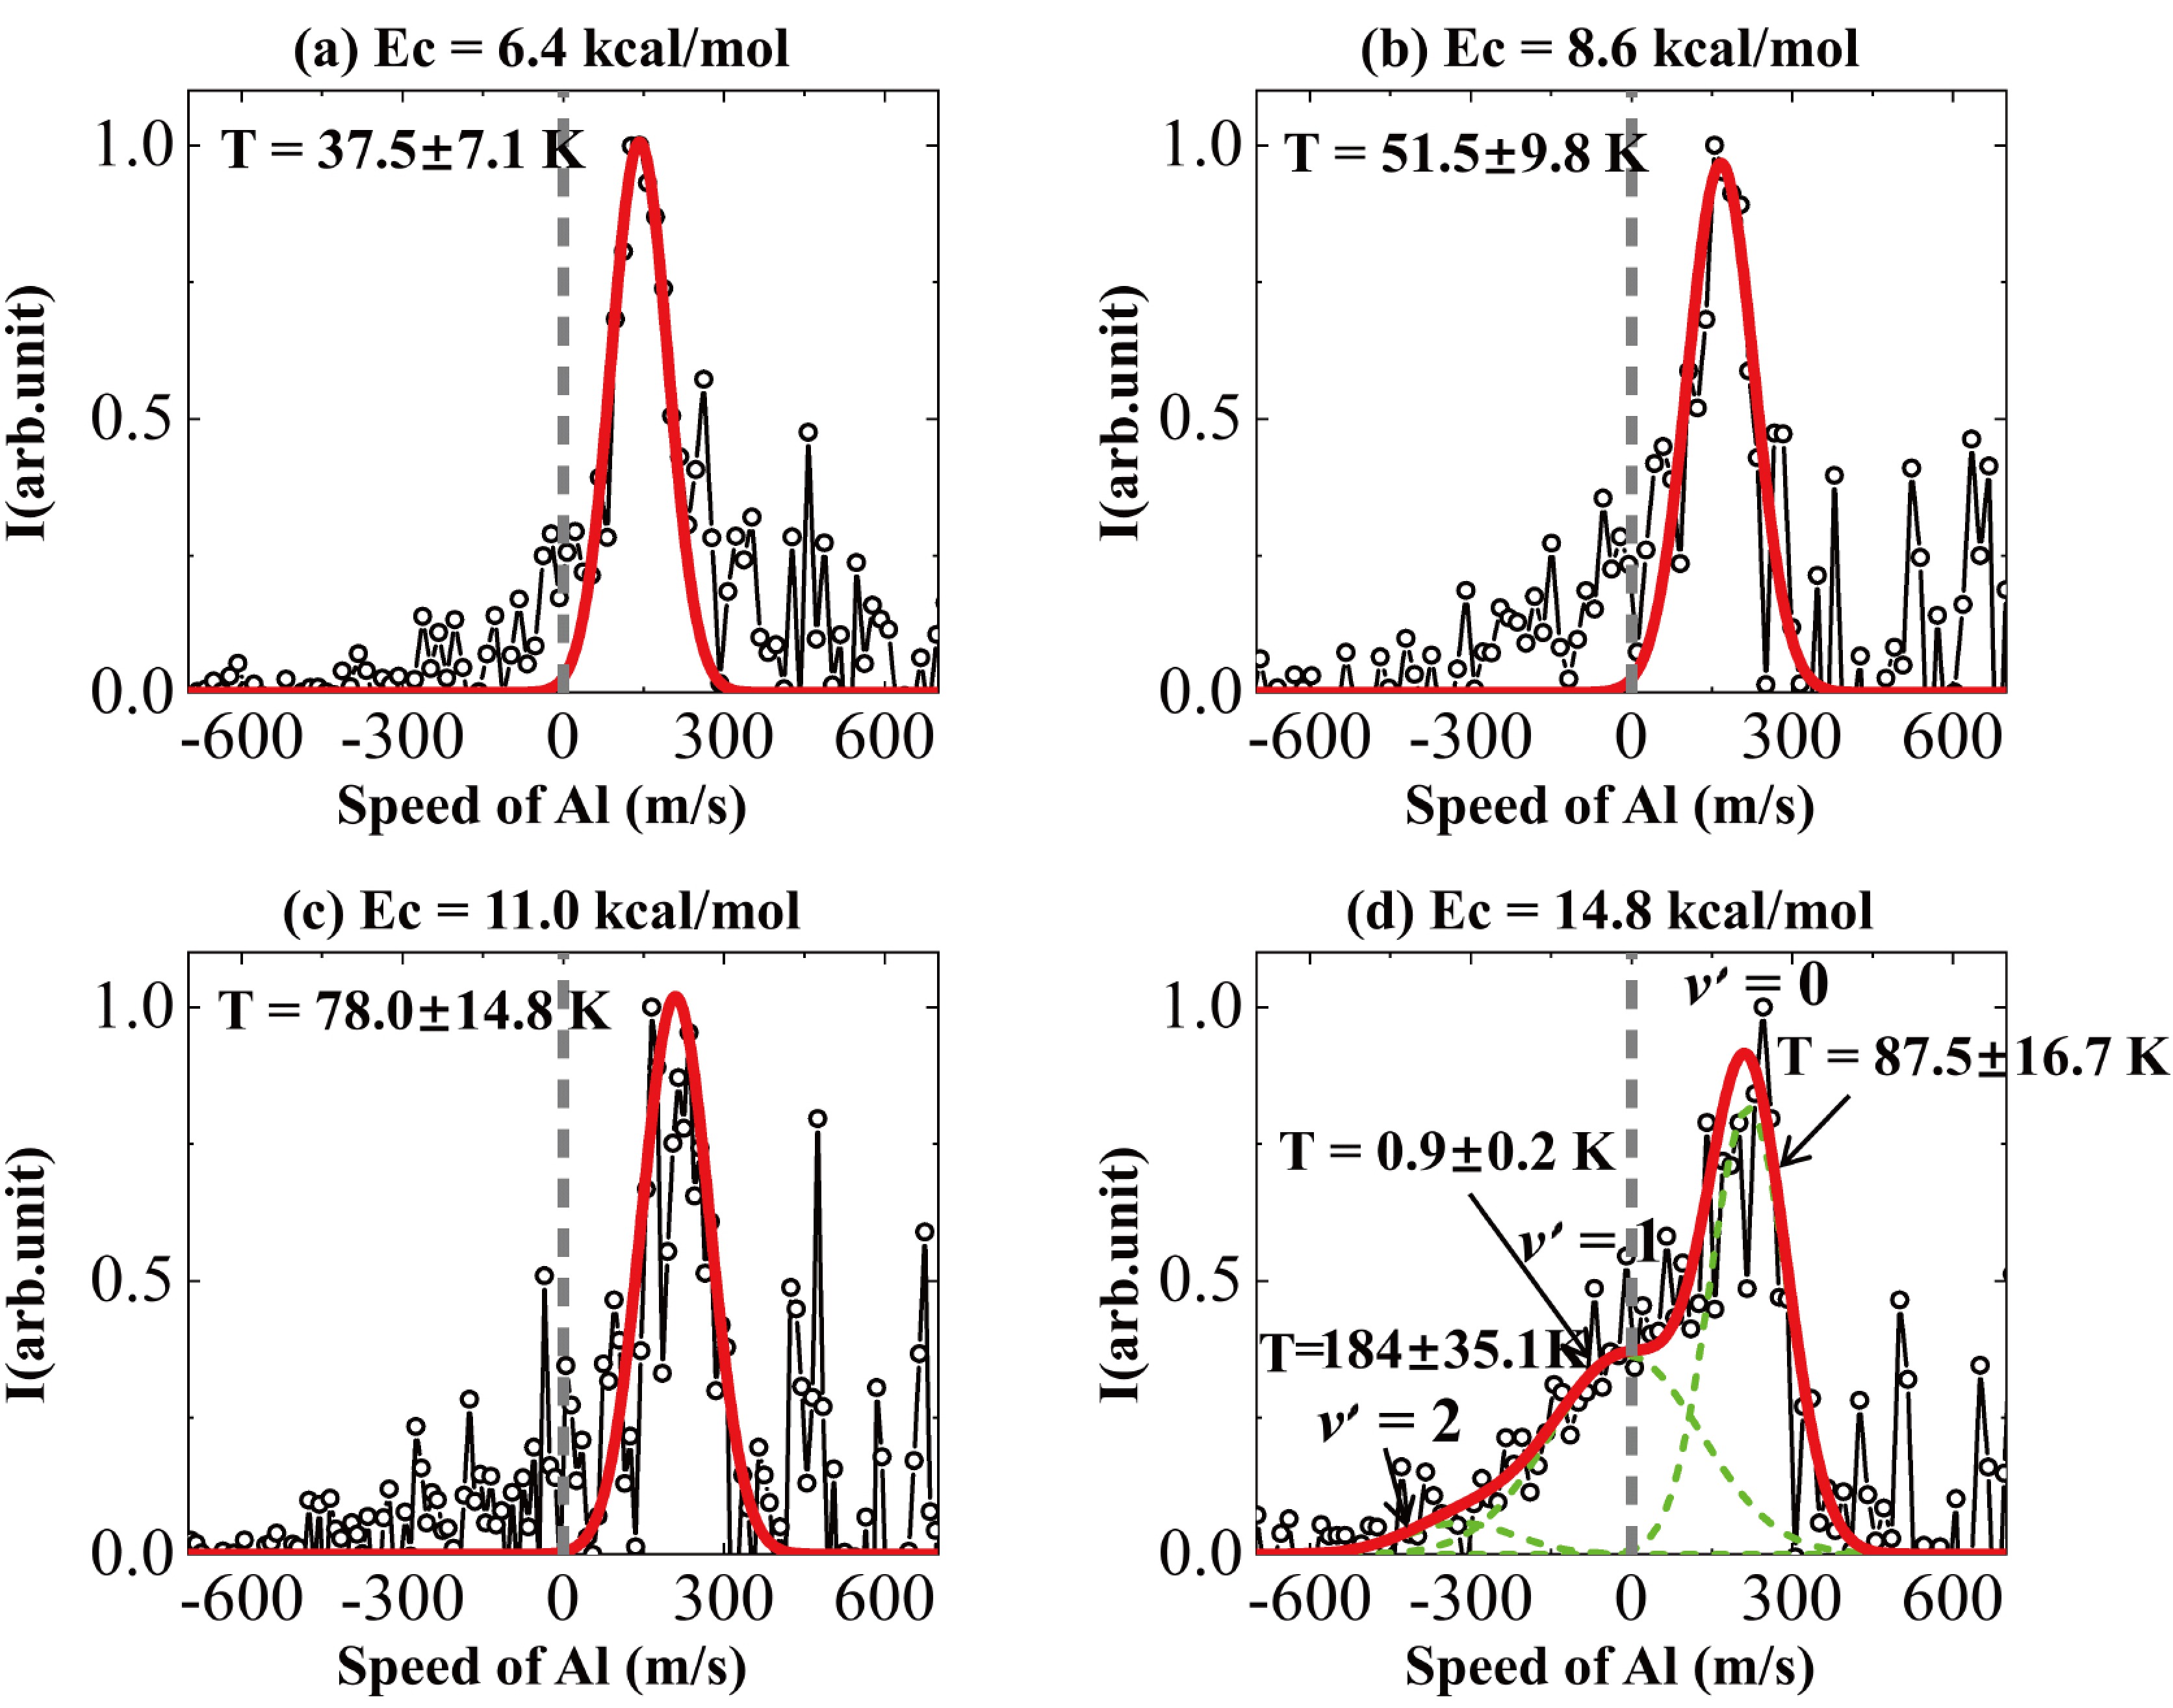
Figure 4. The lab-frame velocity distribution of Al(2P1/2) at the scattering angle of
${\theta }_{\rm{cm}}$ (130.3°, 137.8°, 142.8°, and 148.0°) corresponding to different collosion energies obtained from the images of (a) 6.4 kcal/mol, (b) 8.6 kcal/mol, (c) 11.0 kcal/mol, and (d) 14.8 kcal/mol, respectively. The experimental data points are represented by hollow circles, and the red lines indicate the Gaussian fitting. In panel (d), the green lines illustrate the results of multi-peak Gaussian fitting, with the peak positions assigned based on the vibrational states of O2. The gray vertical dashed line indicates the position at which the lab velocity is zero.
Figure
4 ,Table
0 个