-
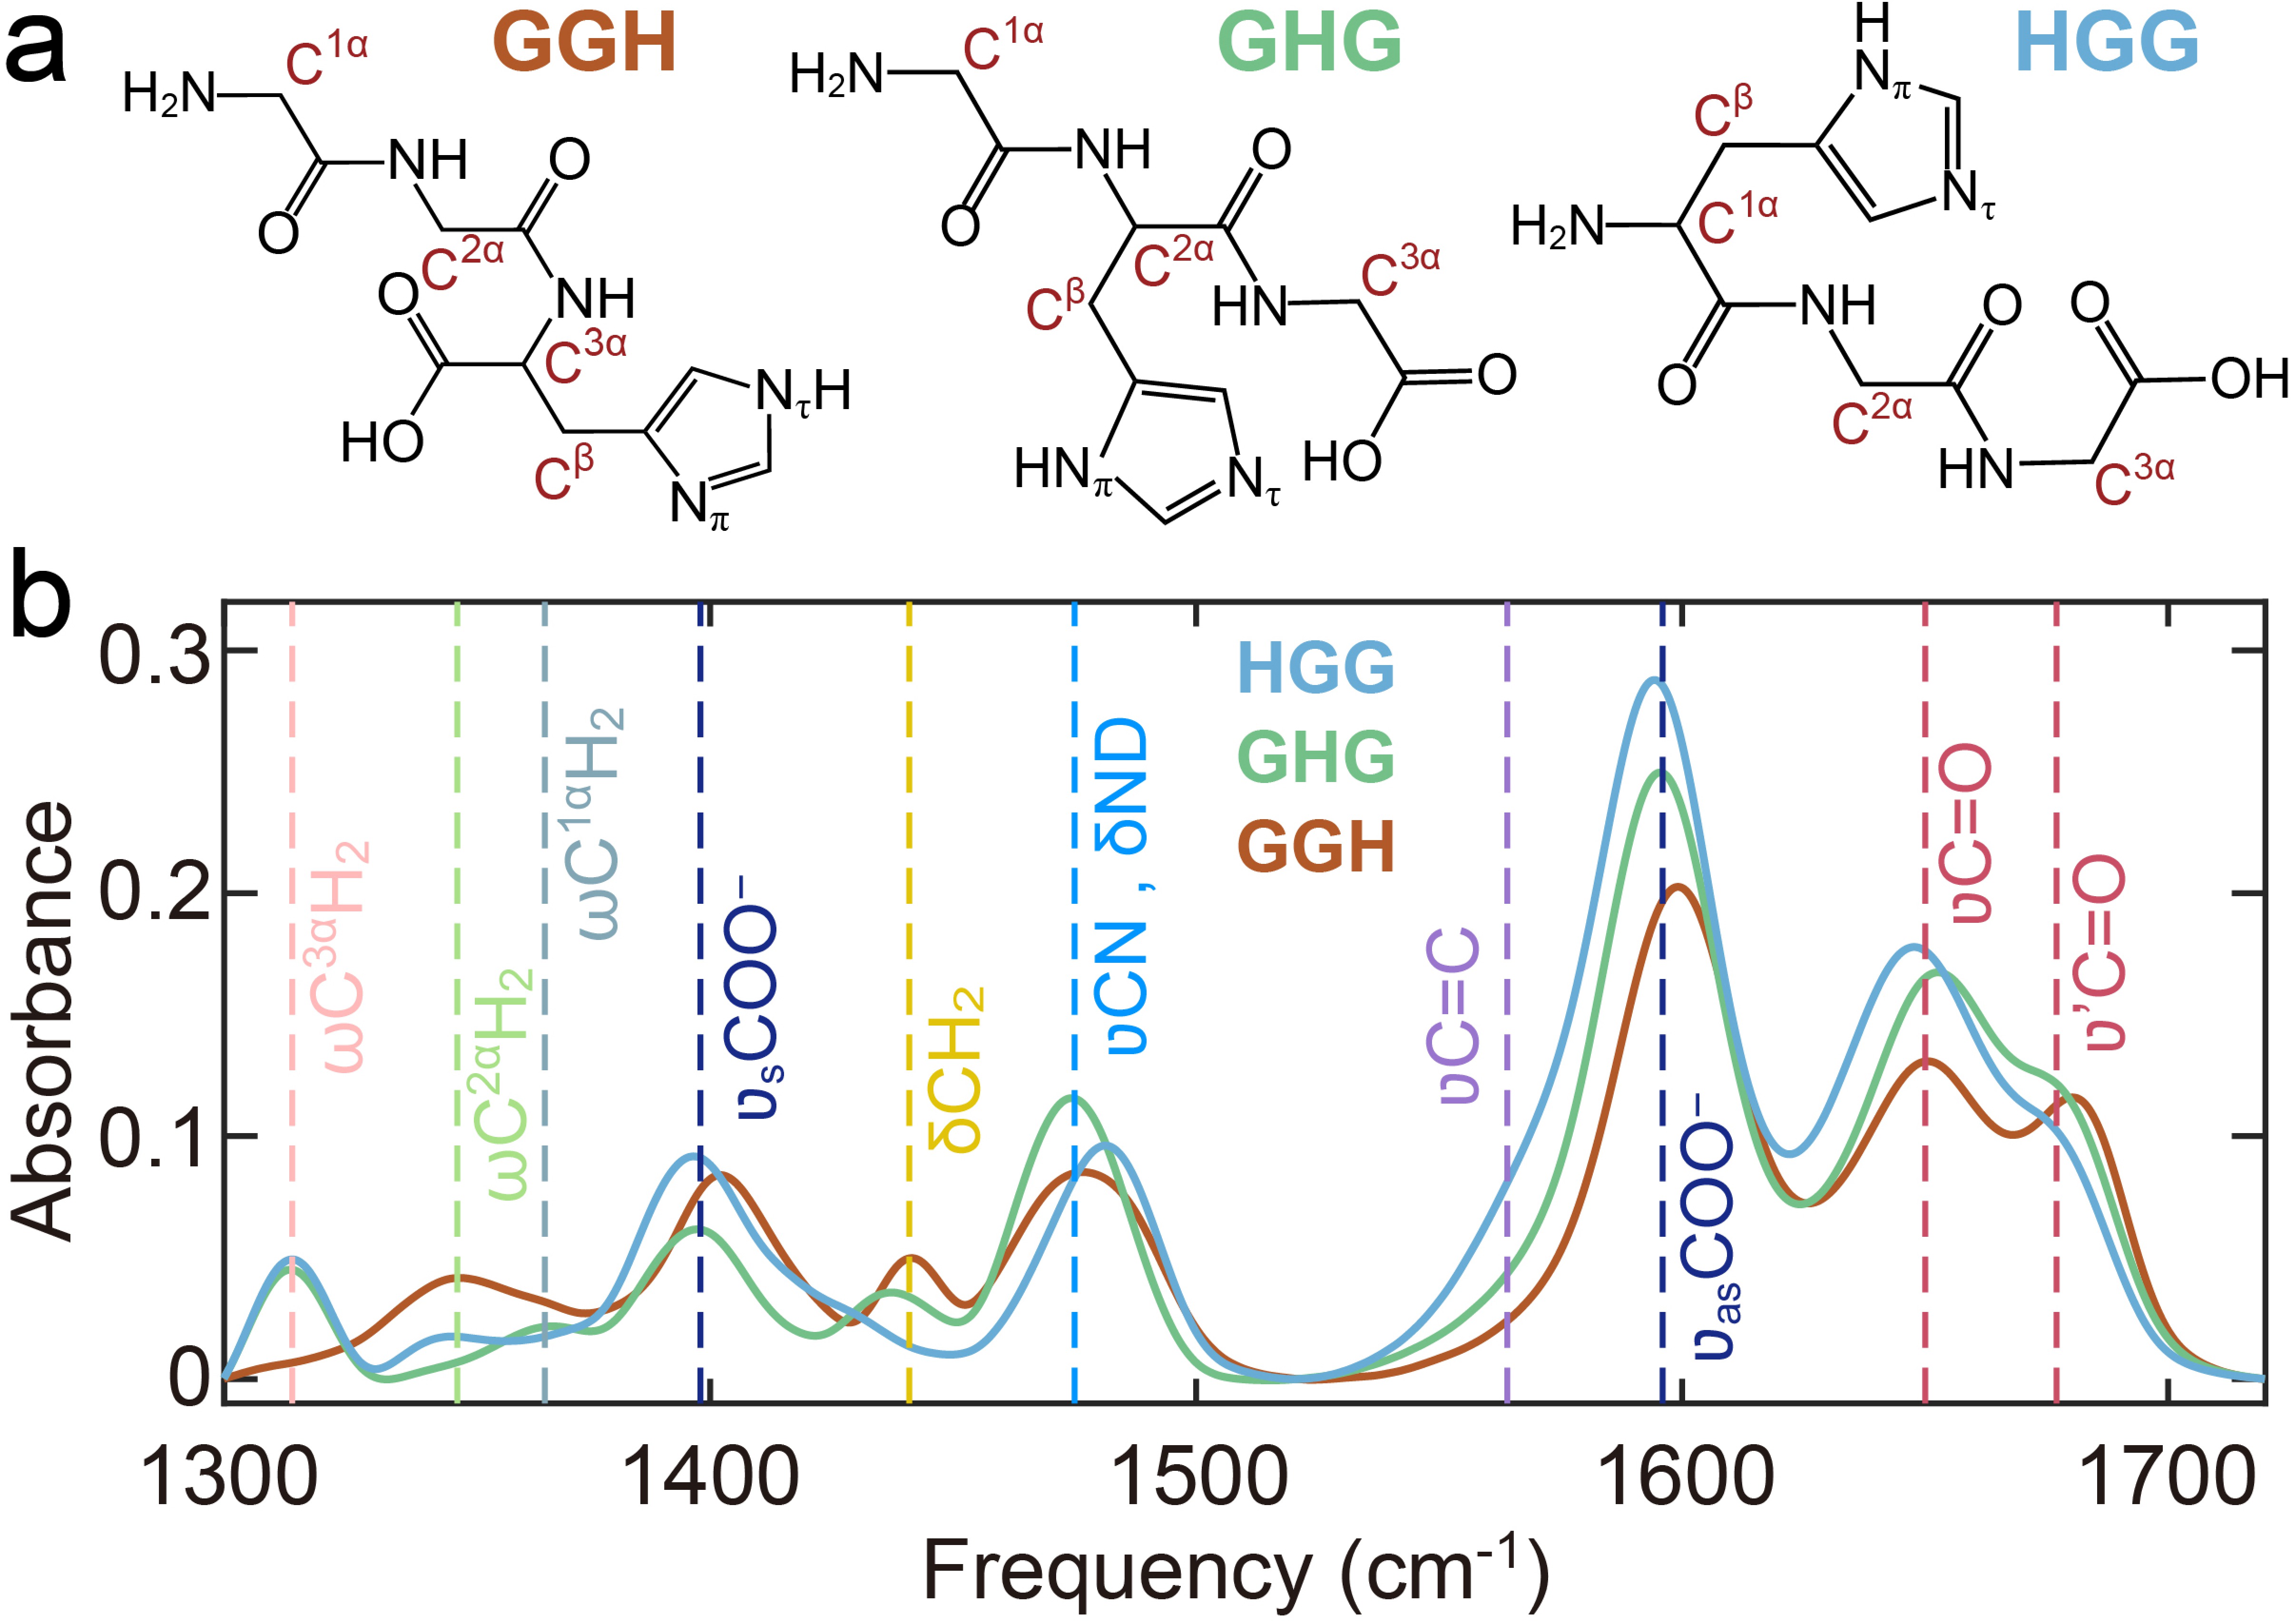
Figure 1. Structural and spectroscopic characterization of tripeptides. (a) Molecular structures of GGH, GHG, and HGG. (b) FTIR spectra in 200 mmol/L Tris-DCl buffer (pH 7), with dashed lines highlighting characteristic vibrational bands.
-
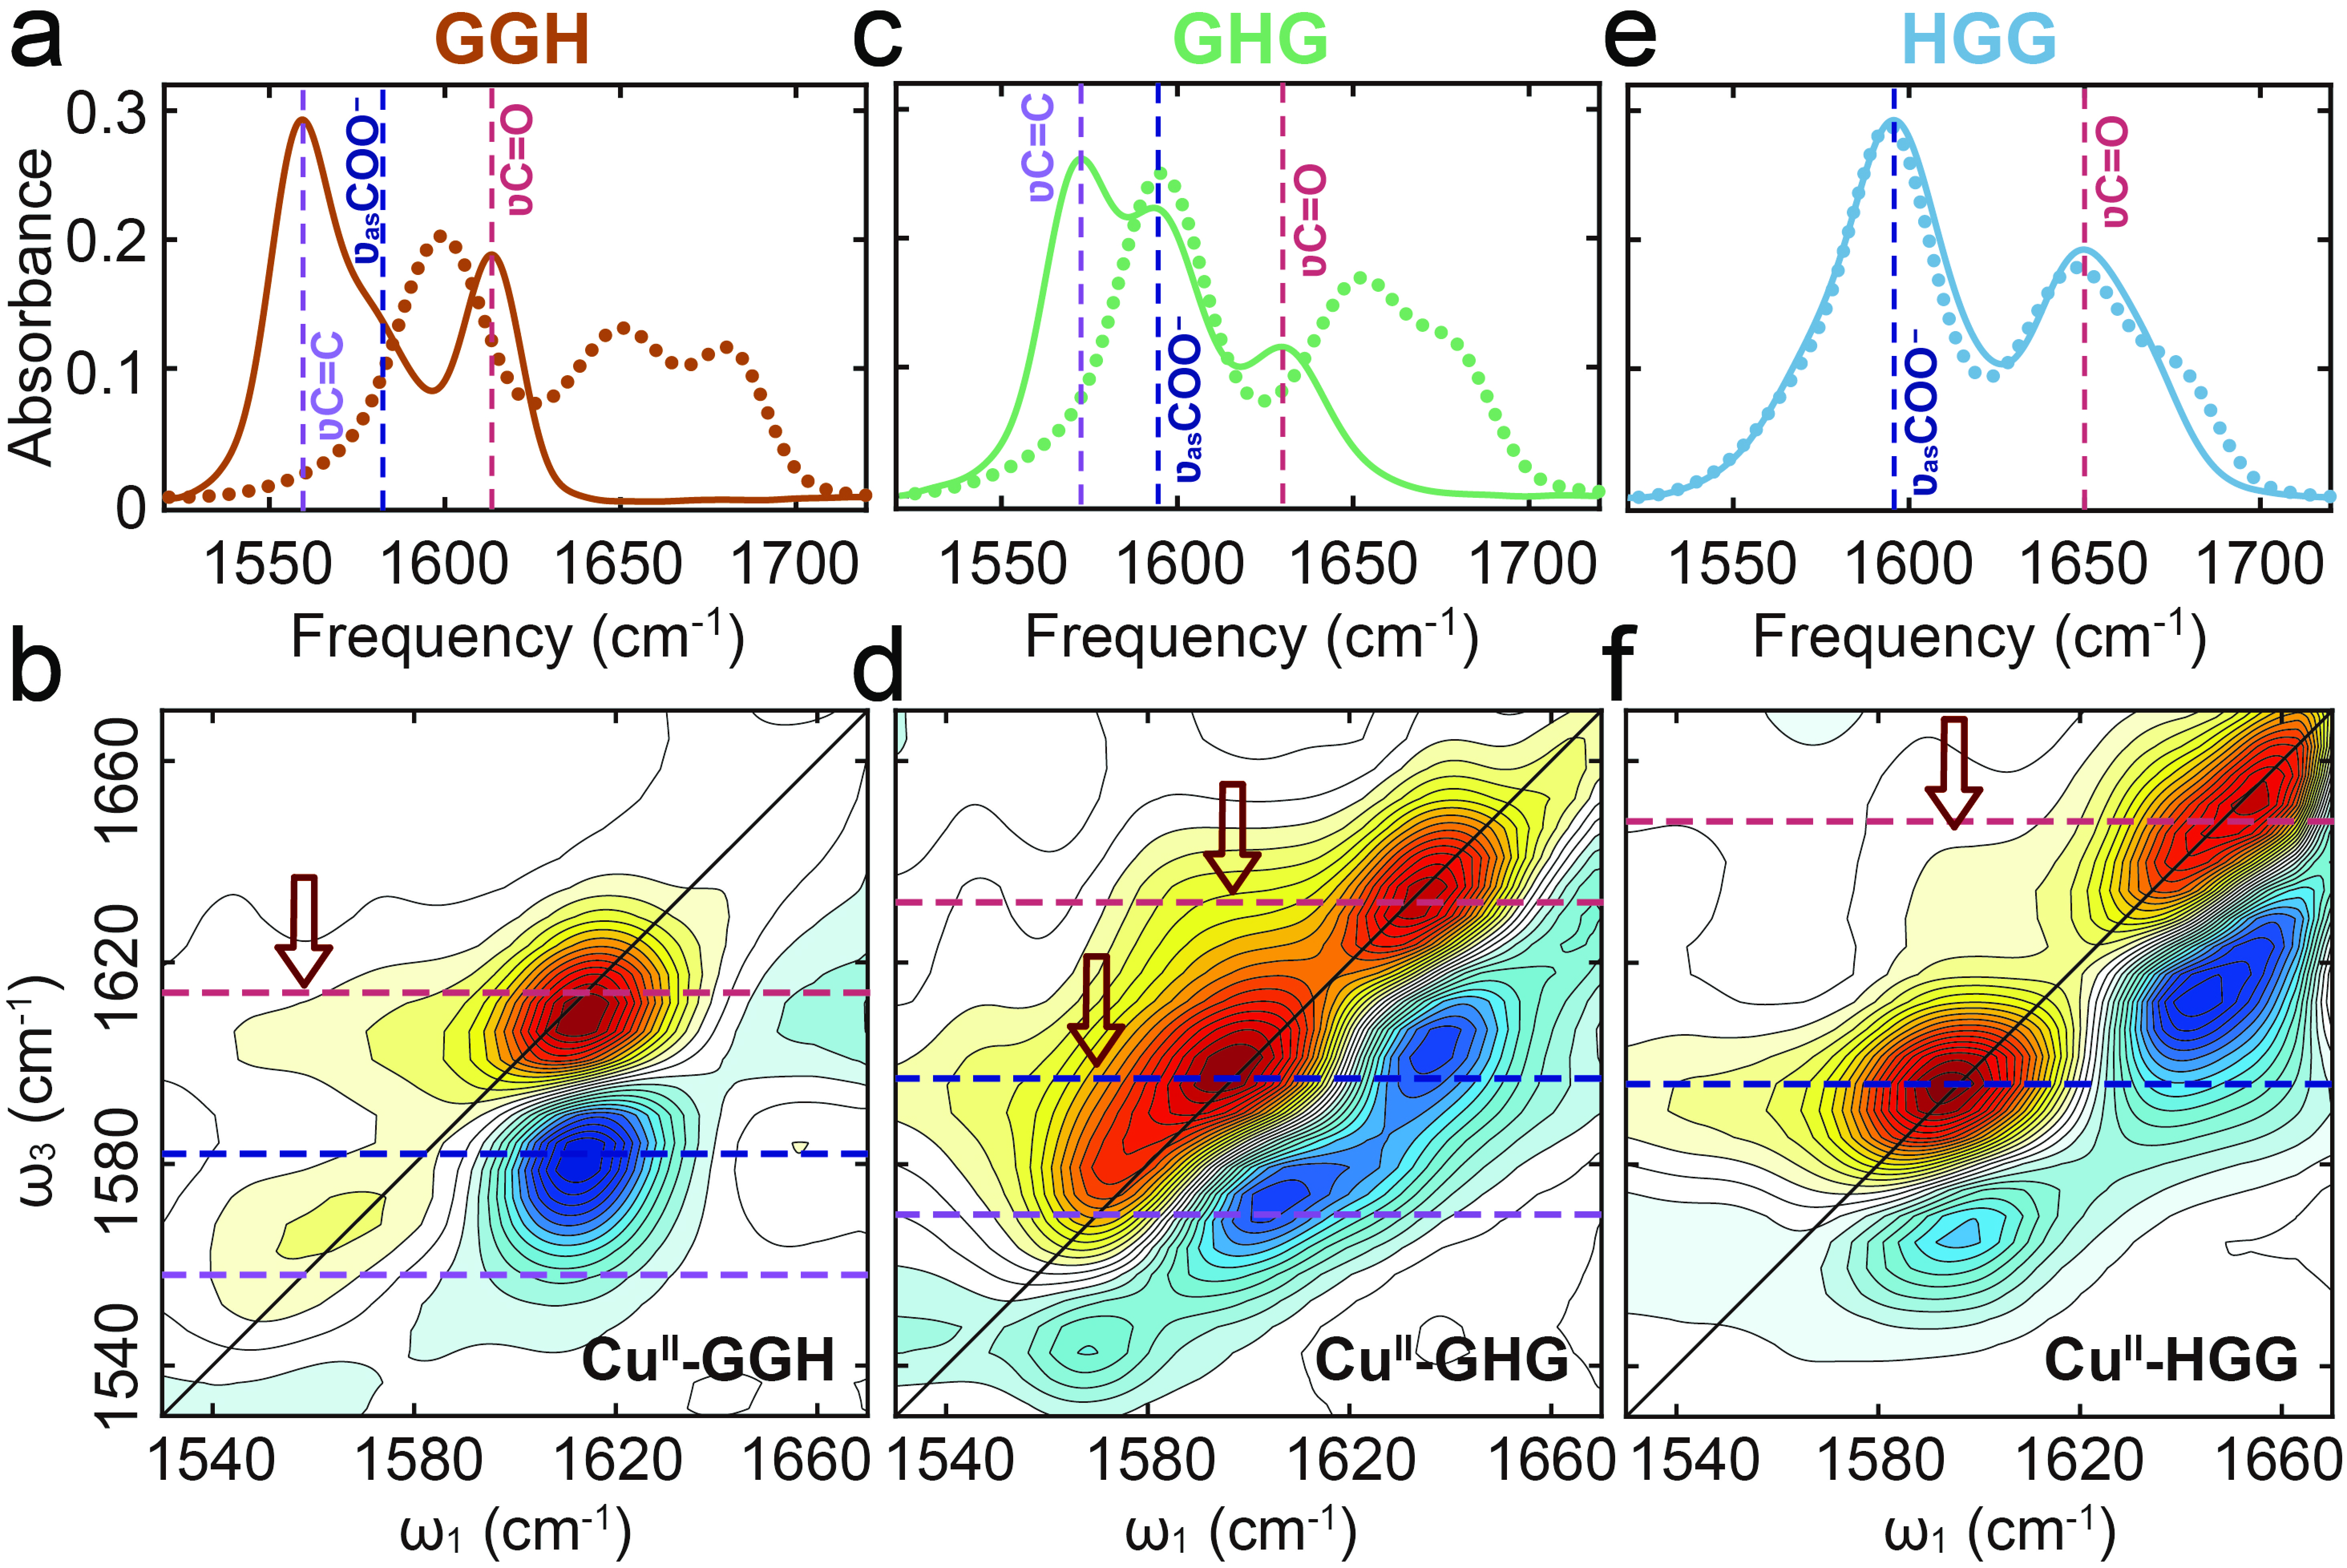
Figure 2. Spectroscopic characterization of tripeptides and their Cu(II) complexes at pH 7. (a, c, e) FTIR spectra of GGH, GHG and HGG (dotted lines) and their corresponding Cu(II) complexes (solid lines). (b, d, f) 2D IR spectra of Cu(II)-GGH, Cu(II)-GHG, and Cu(II)-HGG, respectively. Dashed lines highlight the characteristic vibrational bands.
-
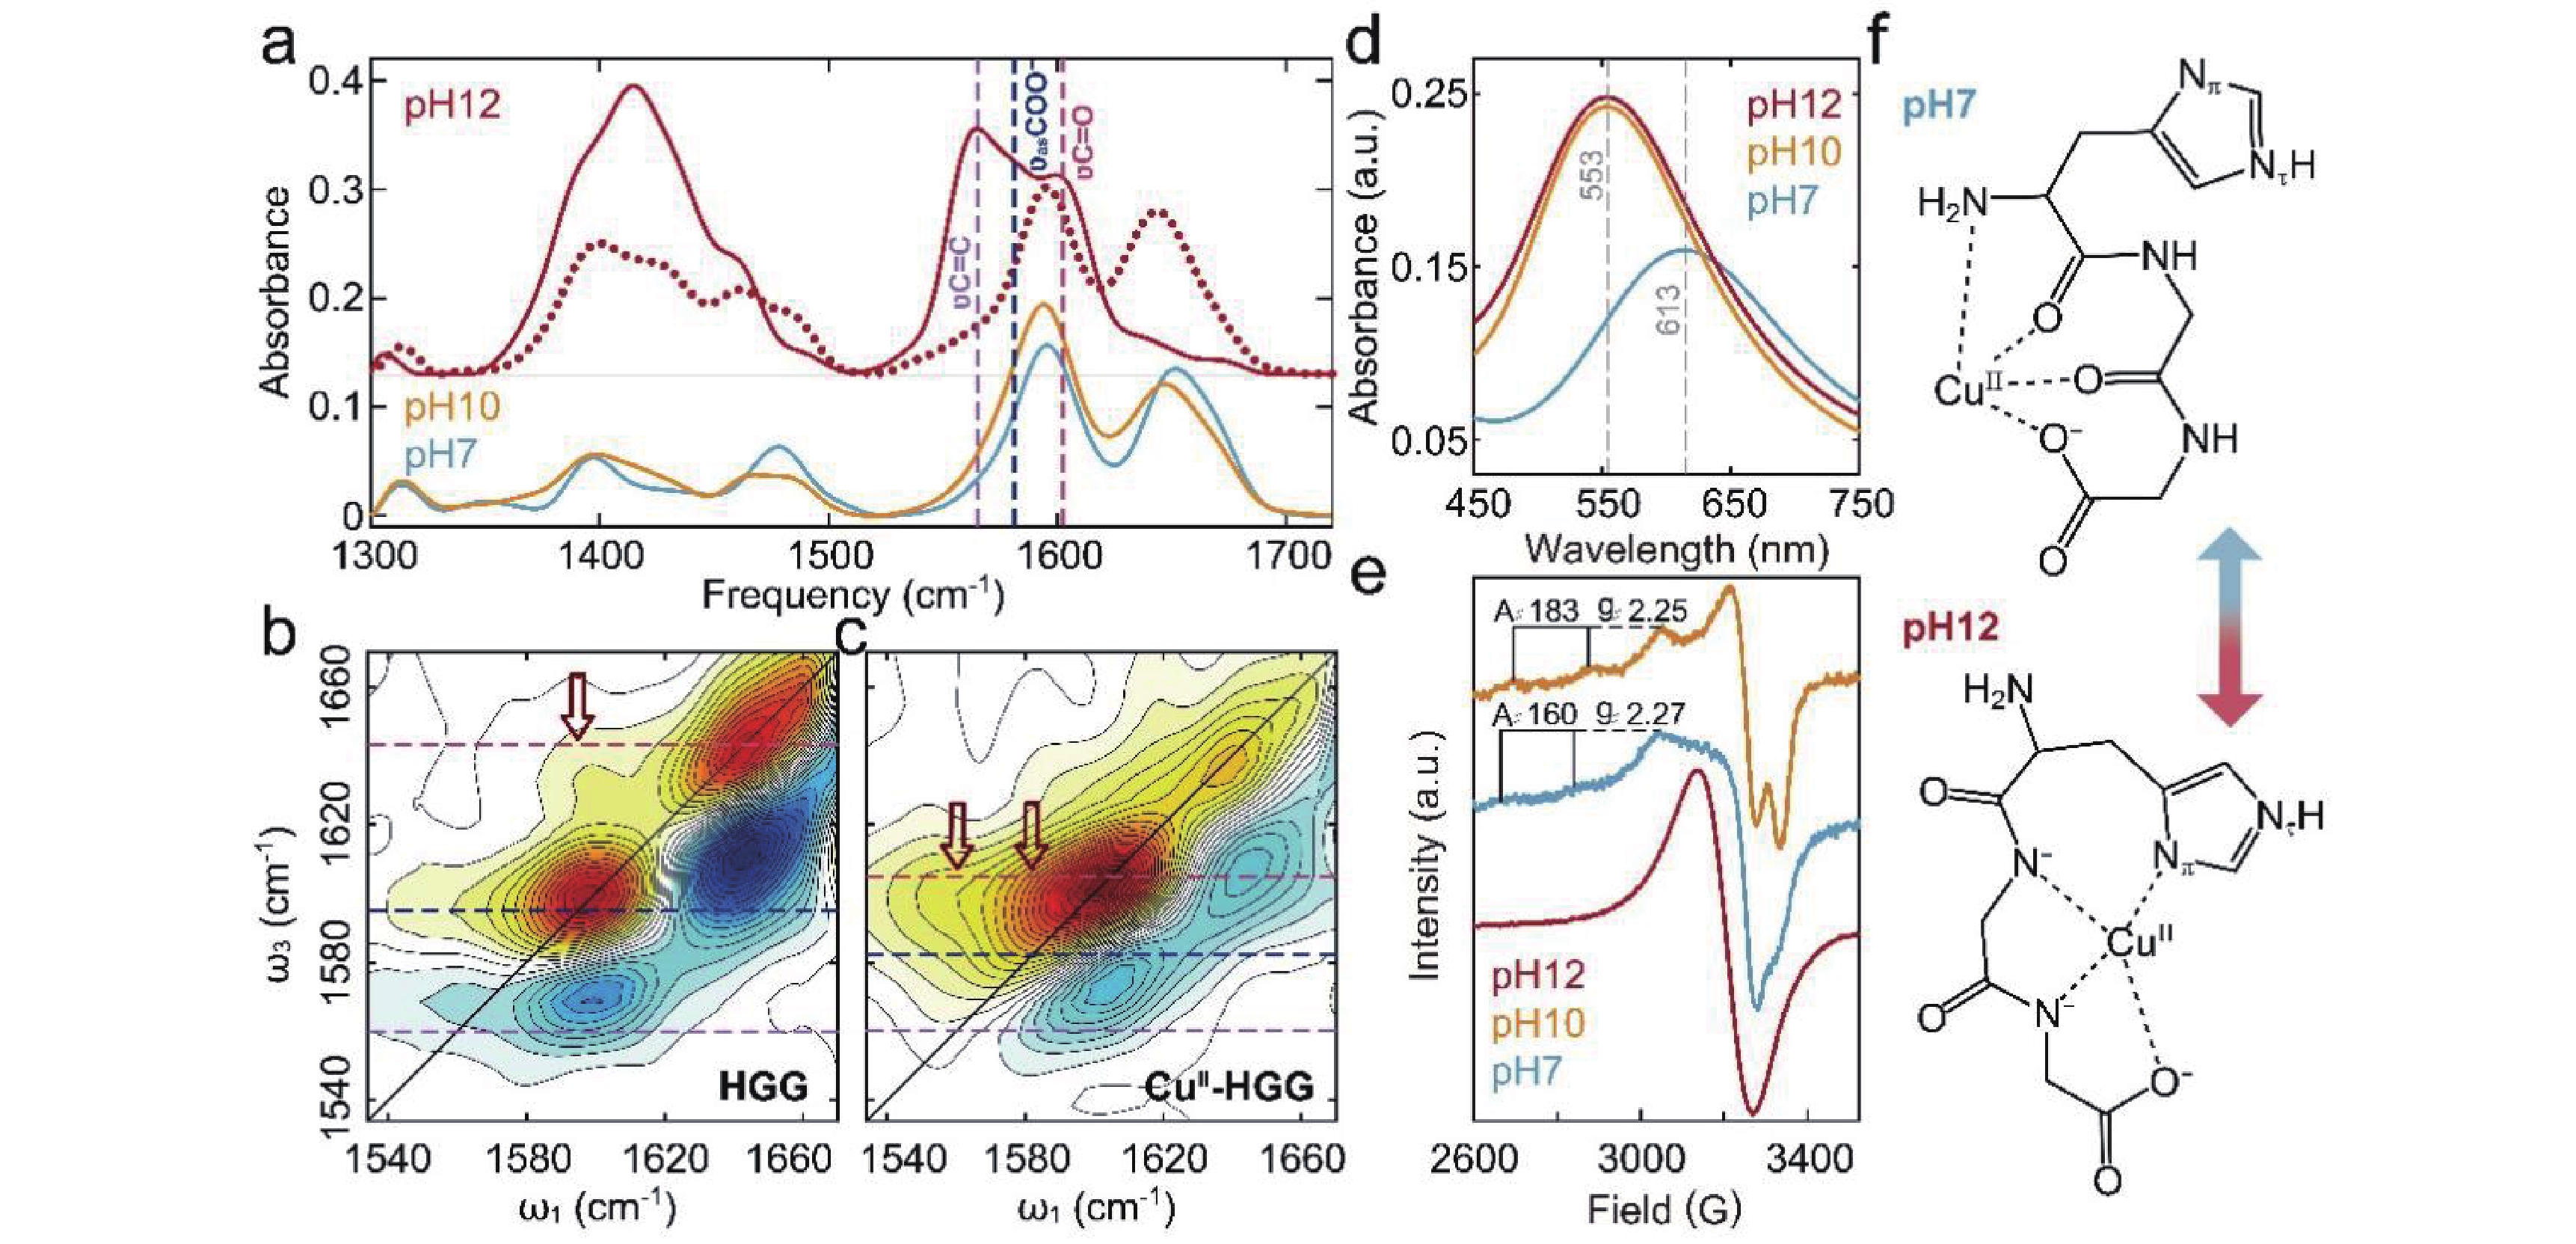
Figure 3. pH-dependent coordination of Cu(II)-HGG investigated by spectroscopic methods. (a) FTIR spectra of HGG at pH 12 (dotted lines) versus Cu(II)-HGG across pH 7–12 (solid lines). Color-coded dashed lines correlate with key vibrational modes. 2D IR spectra of (b) HGG and (c) Cu(II)-HGG at pH 12, highlighting coordination-sensitive features. (d) UV-Vis and (e) EPR spectra of Cu(II)-HGG across pH 7–12. (f) Proposed Cu(II) coordination geometries at pH 7 (1N3O) and 12 (3N1O).
-
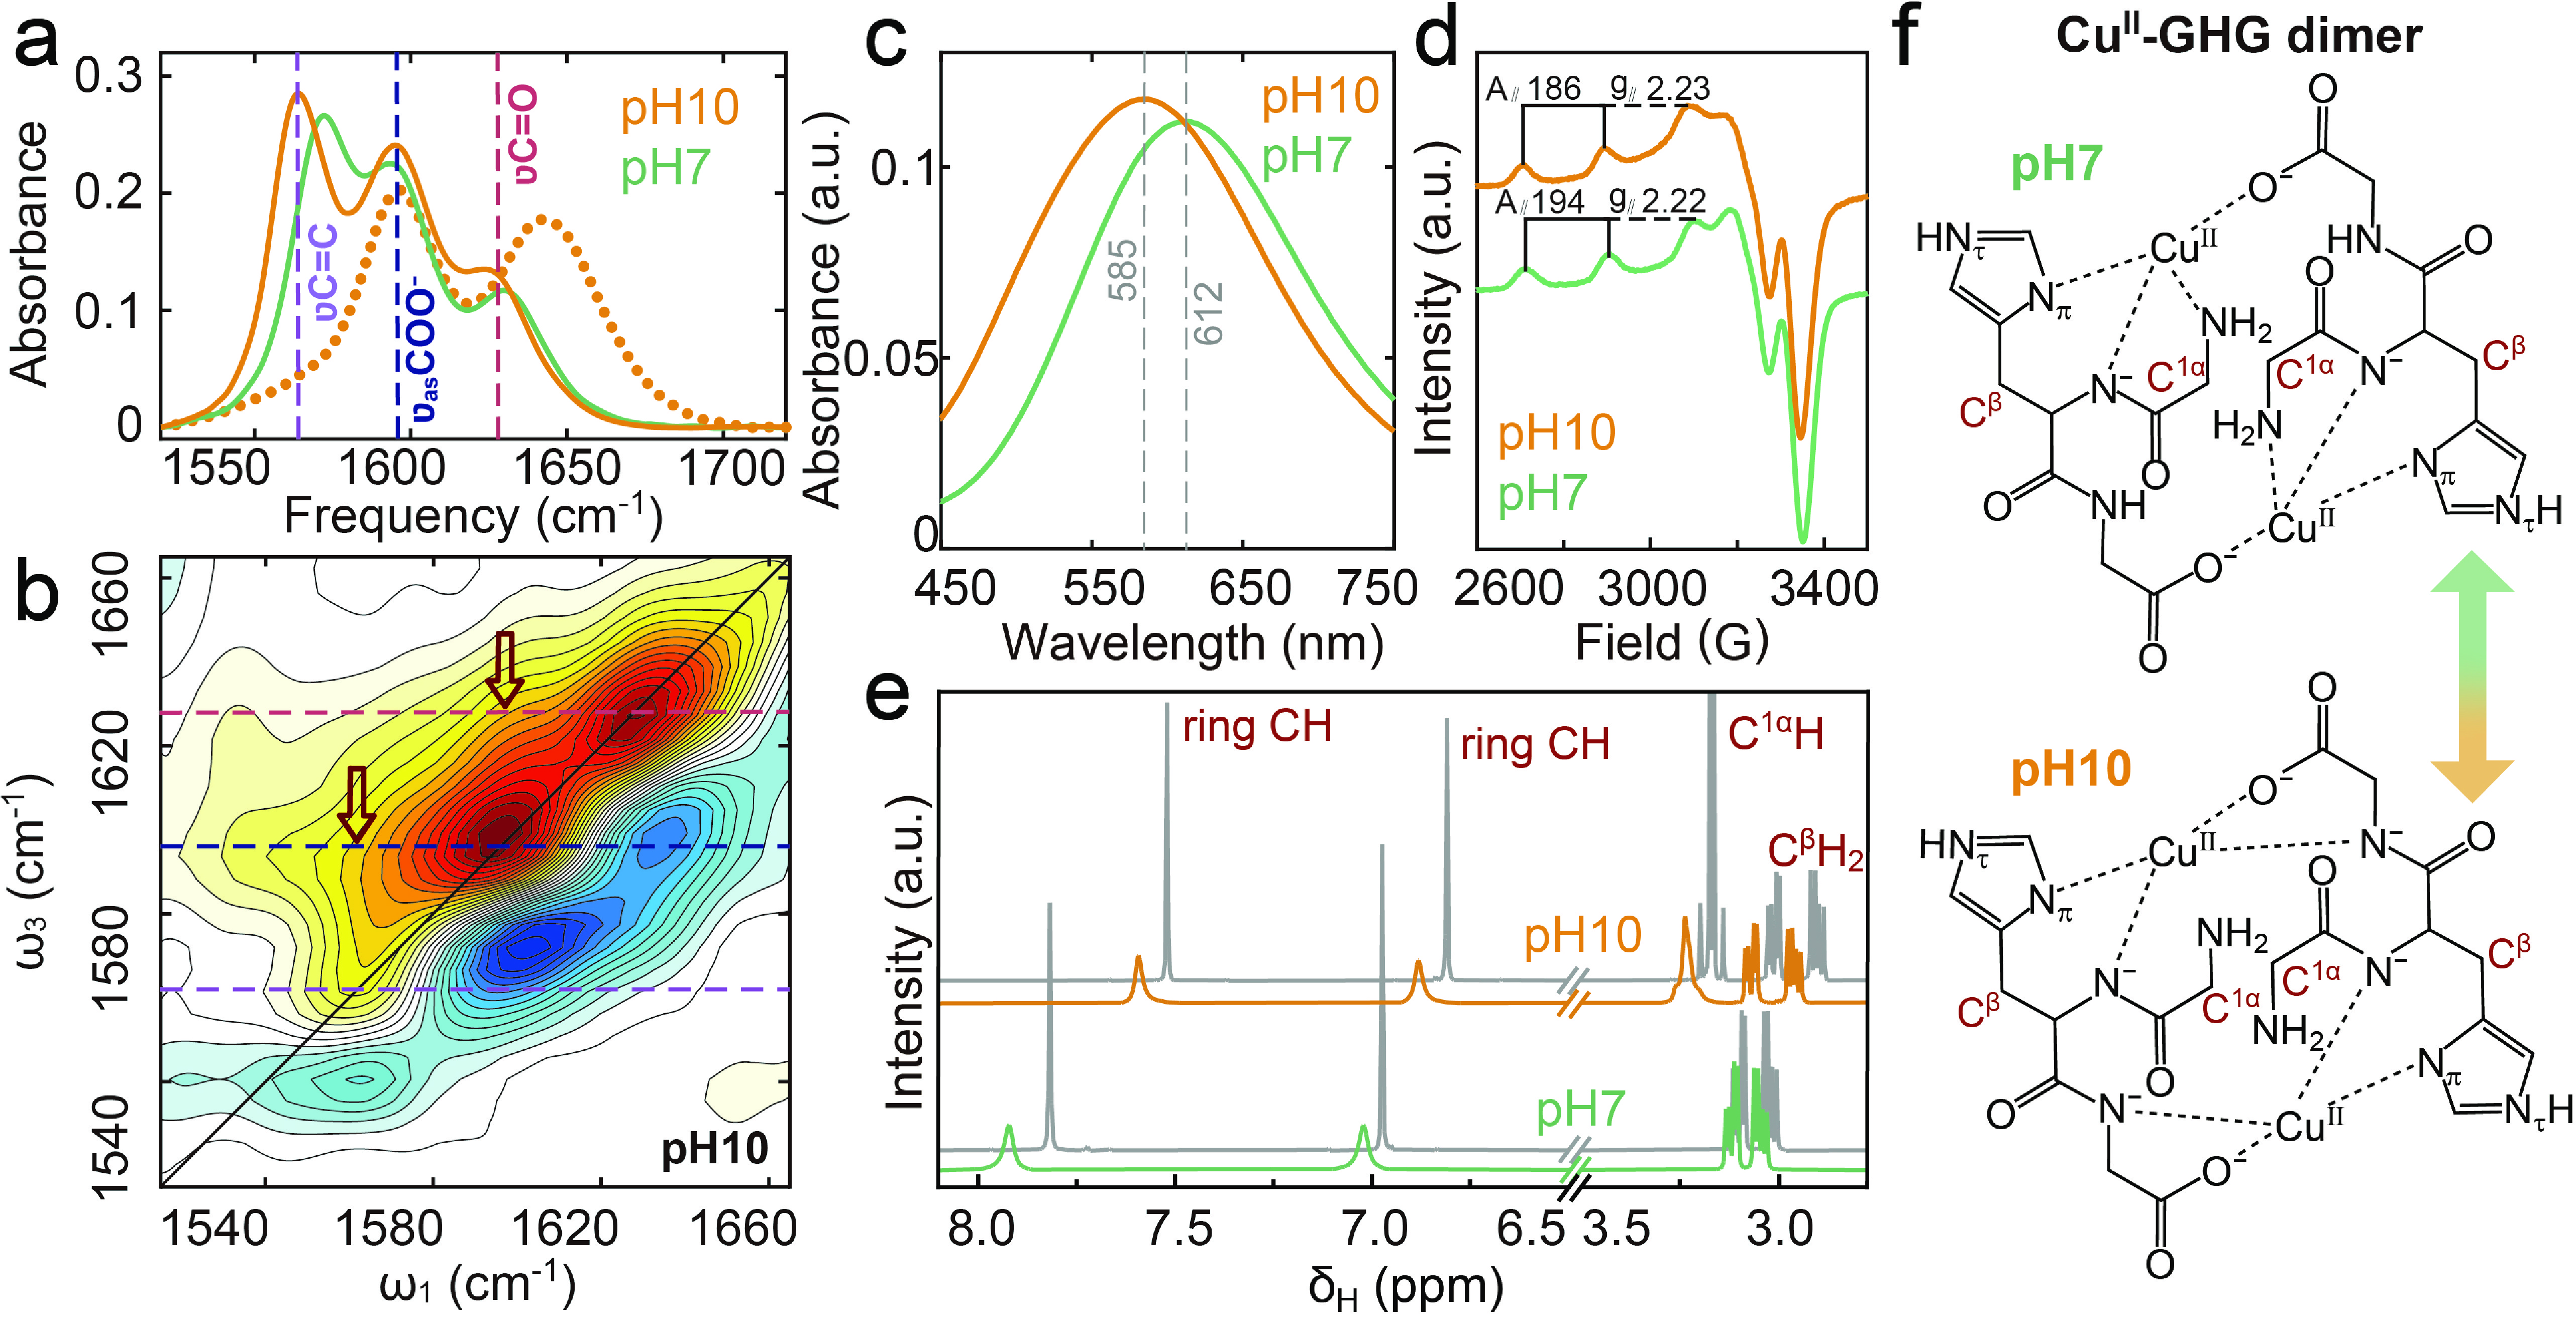
Figure 4. pH-dependent Cu(II) coordination in GHG characterized by multi-spectroscopic analysis. (a) FTIR spectra of GHG (dotted lines) and Cu(II)-GHG (solid lines). (b) 2D IR spectrum of Cu(II)-GHG at pH 10. (c) UV-Vis absorption spectra of Cu(II)-GHG. (d) EPR spectra of Cu(II)-GHG. (e) 1H NMR spectra of GHG (grey line) and Cu(II)-GHG (with Cu(II)/GHG ratio being 1:1000). (f) Proposed structures of Cu(II)-GHG complexes at pH 7 and 10.
Figure
4 ,Table
0 个