-
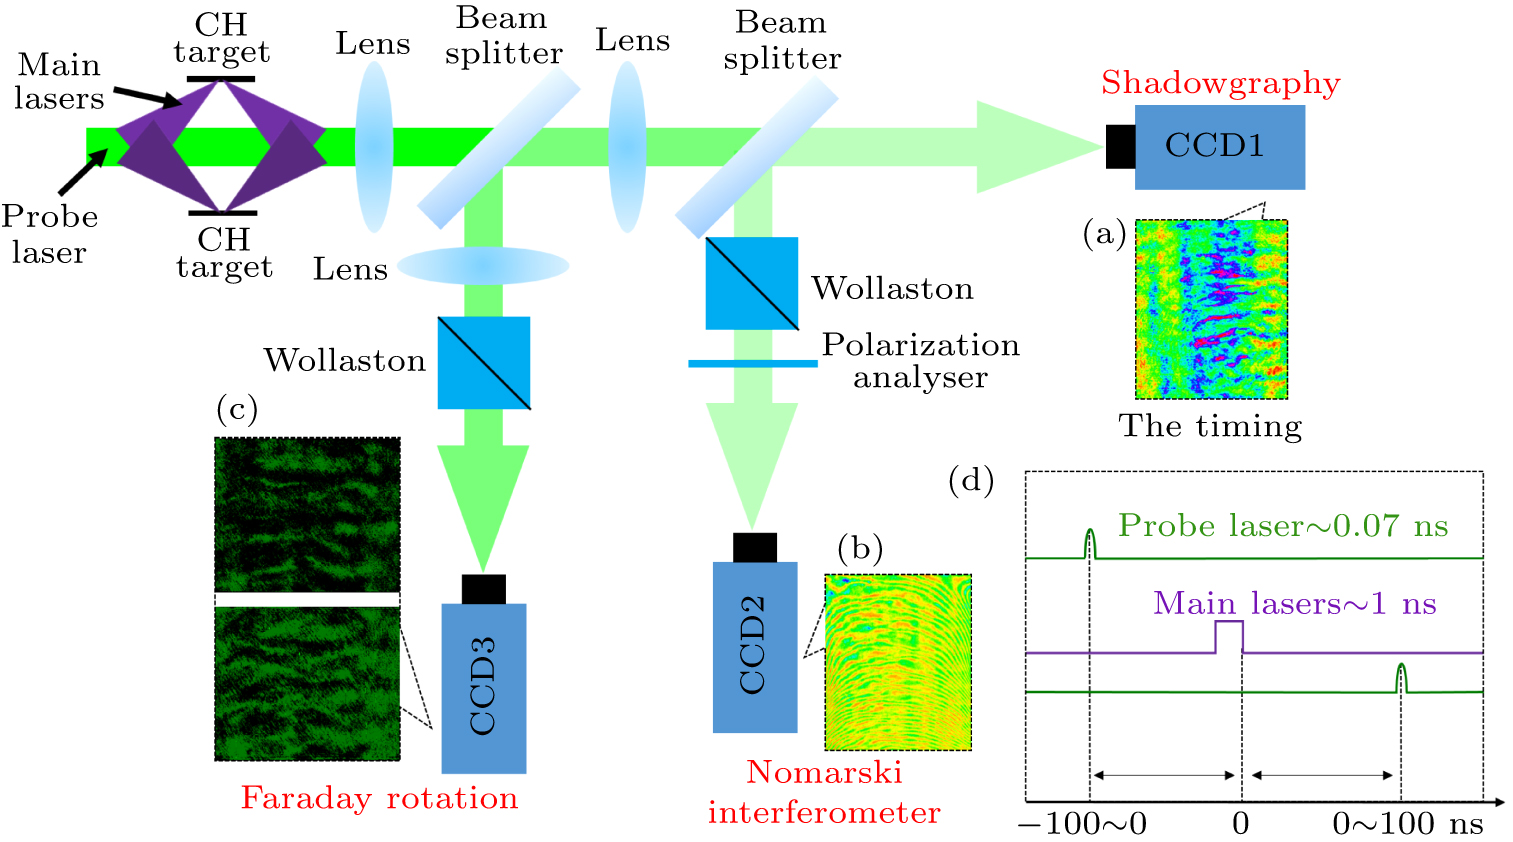
Figure 1. The overall experimental layout (main beams and targets are in the vacuum chamber). The original figures of 4 ns are shown in (a) shadowgraphy, (b) Nomarski interferometer, and (c) Faraday rotation. The timing of the lasers are shown in panel (d), where the time interval between the probe and the main lasers can be adjusted within −100 ns to 100 ns.
-
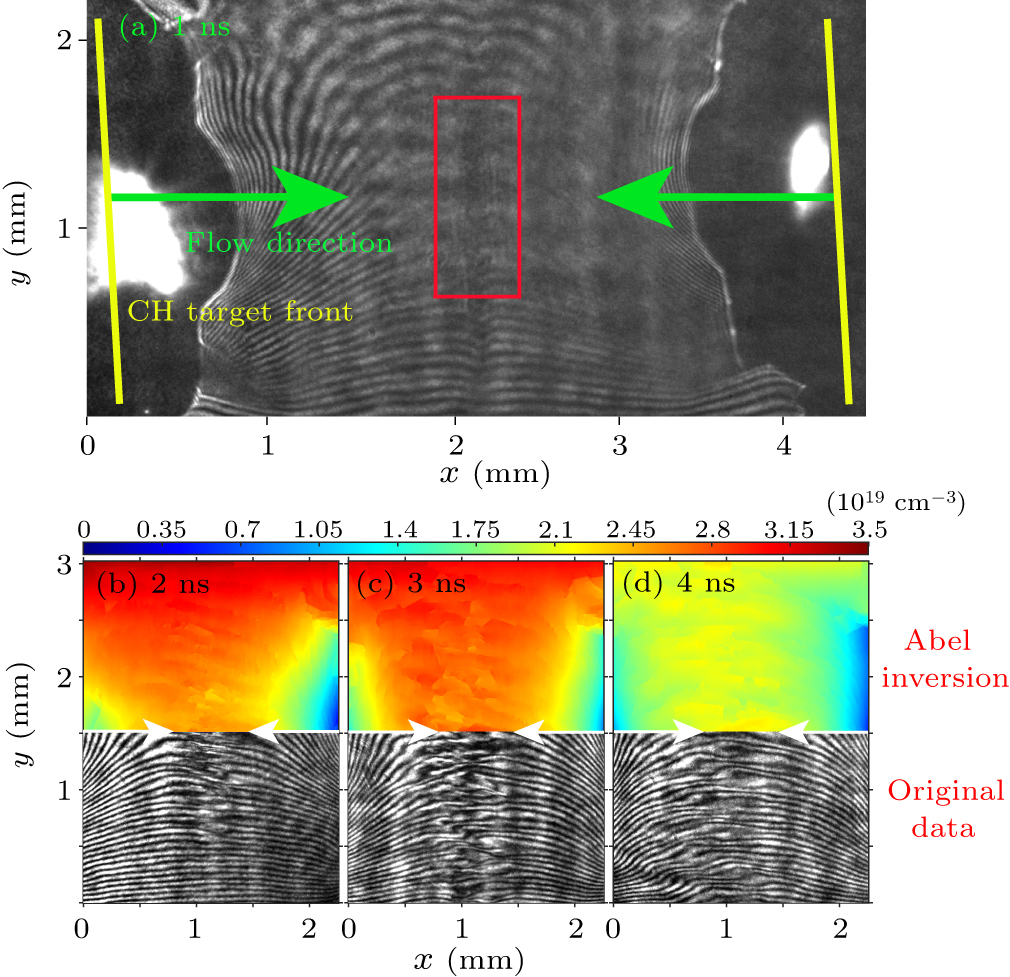
Figure 2. (a) Original figures of 1 ns. The yellow lines represent the CH targets front. The green arrows represent the plasma flows direction. The red rectangle is in the middle of two CH targets, the bending of the interference fringes in the red rectangle represents the meeting of two plasma flows. Panels (b)–(d) are Abel inversion density figures (up) and interferometric original figures (below), taken at 2 ns, 3 ns, and 4 ns. The color bar represents the value of the electron density (up).
-
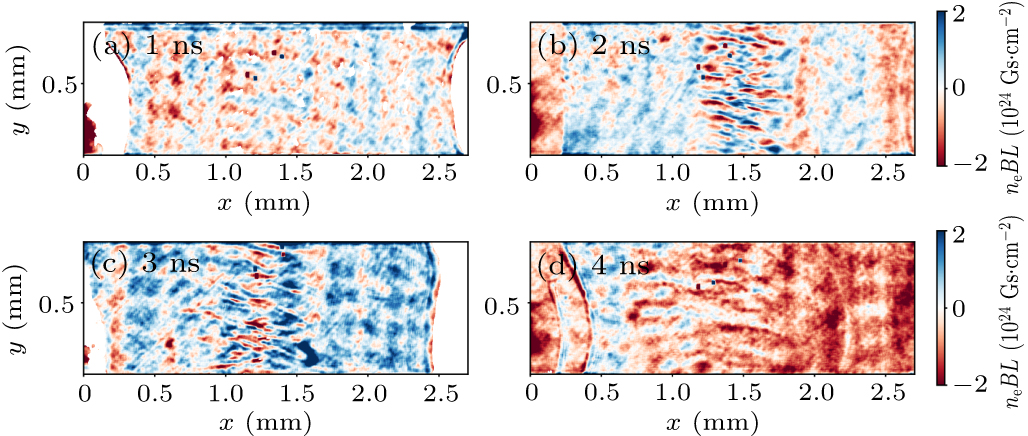
Figure 3. The path integral of the magnetic strength at 1 ns (a), 2 ns (b), 3 ns (c) and 4 ns (d). The color bars represent the value of the path integral of the magnetic strength.
-
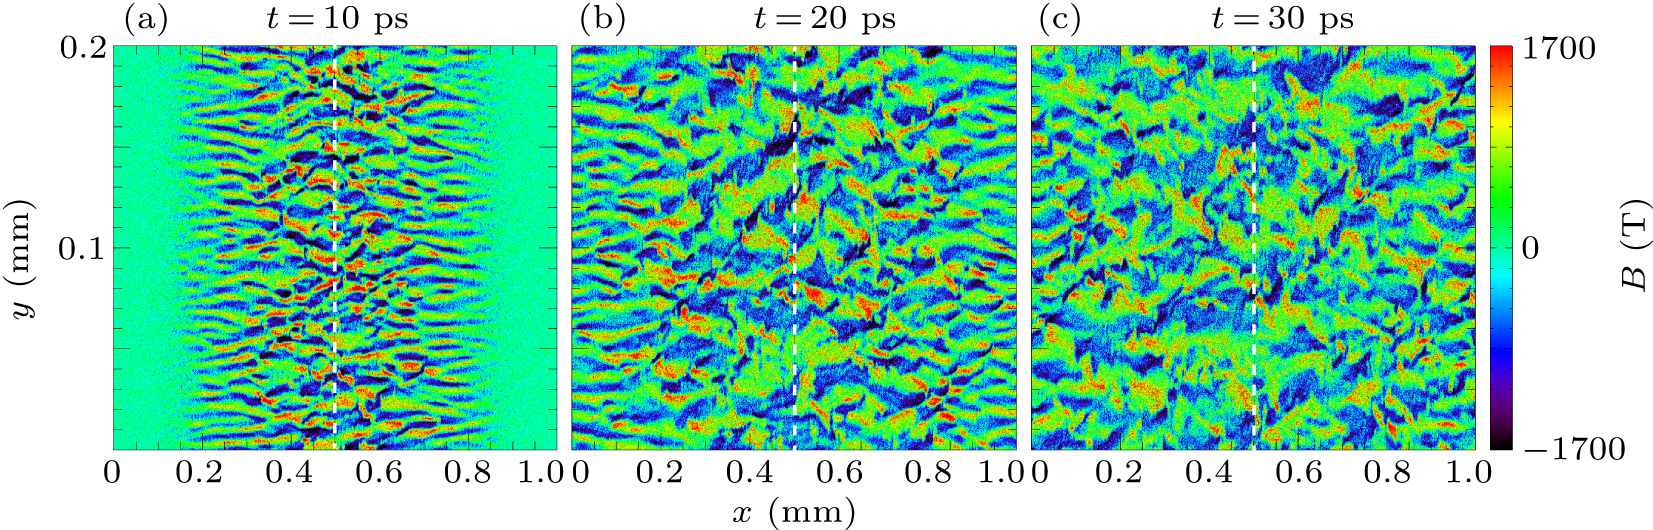
Figure 4. Scaled-down 2D PIC simulations of WI. The color bar represents the value of magnetic strength. The white dashed lines represent the mindplane. The moment when two plasma flows meet at the midplane is the starting moment (t = 0). Under scaling laws, panels (a), (b), and (c) correspond to 2 ns, 3 ns, and 4 ns in the experiment, respectively.
Figure
4 ,Table
1 个