-
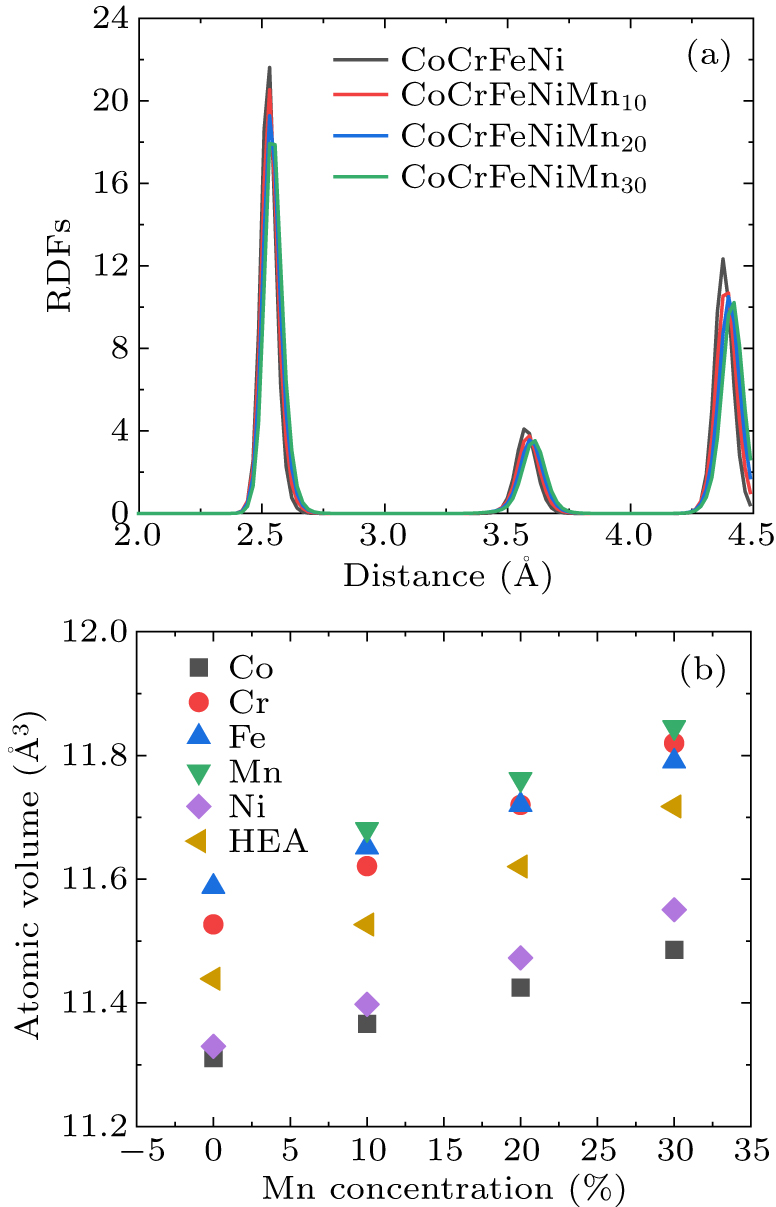
Figure 1. Effect of Mn content on (a) RDFs and (b) atomic volume of CoCrFeNiMnx HEA at a temperature of 1 K.
-
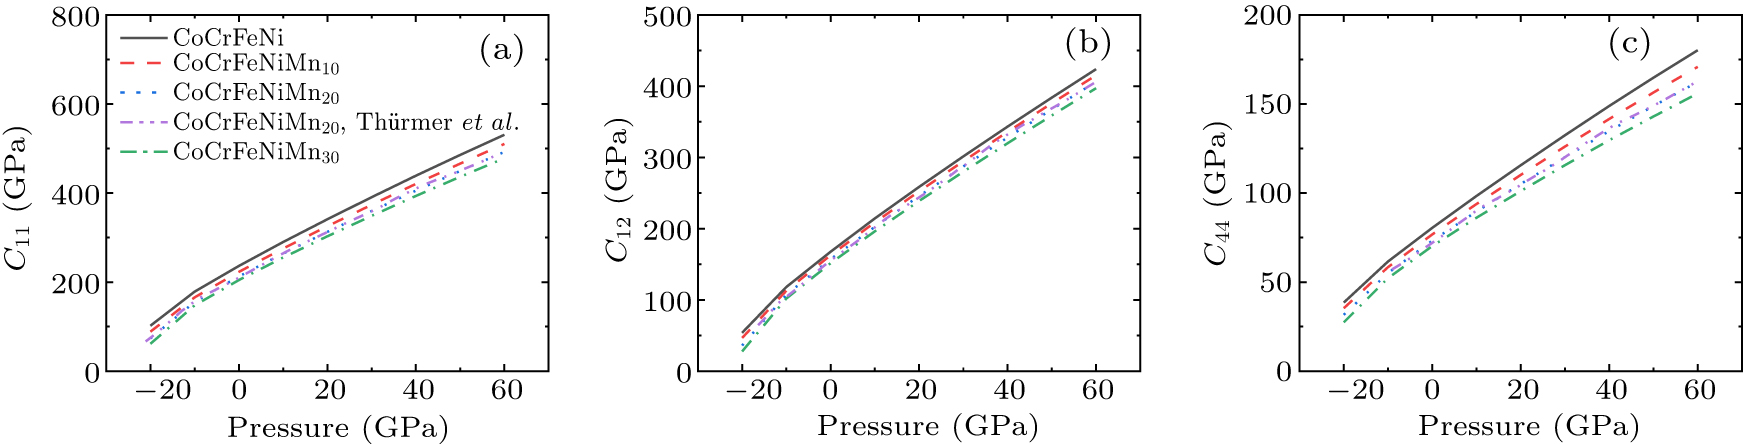
Figure 2. The elastic modulus of CoCrFeNiMnx HEA at a temperature of 1 K. (a) C11, (b) C12, (c) C44. The results of CoCrFeNiMn20 HEA are compared with those of Thürmer et al. in Ref. [22].
-
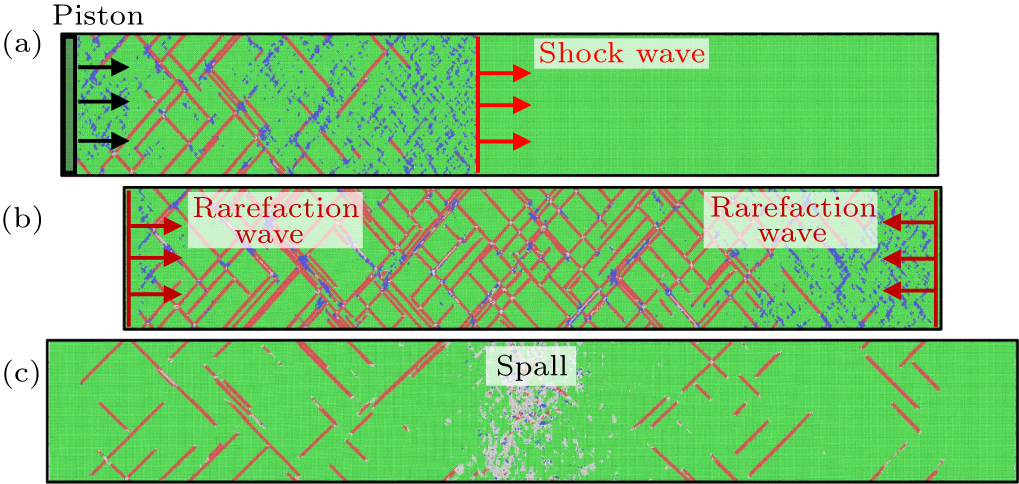
Figure 3. Schematic diagram of the shock response of the HEA.
-
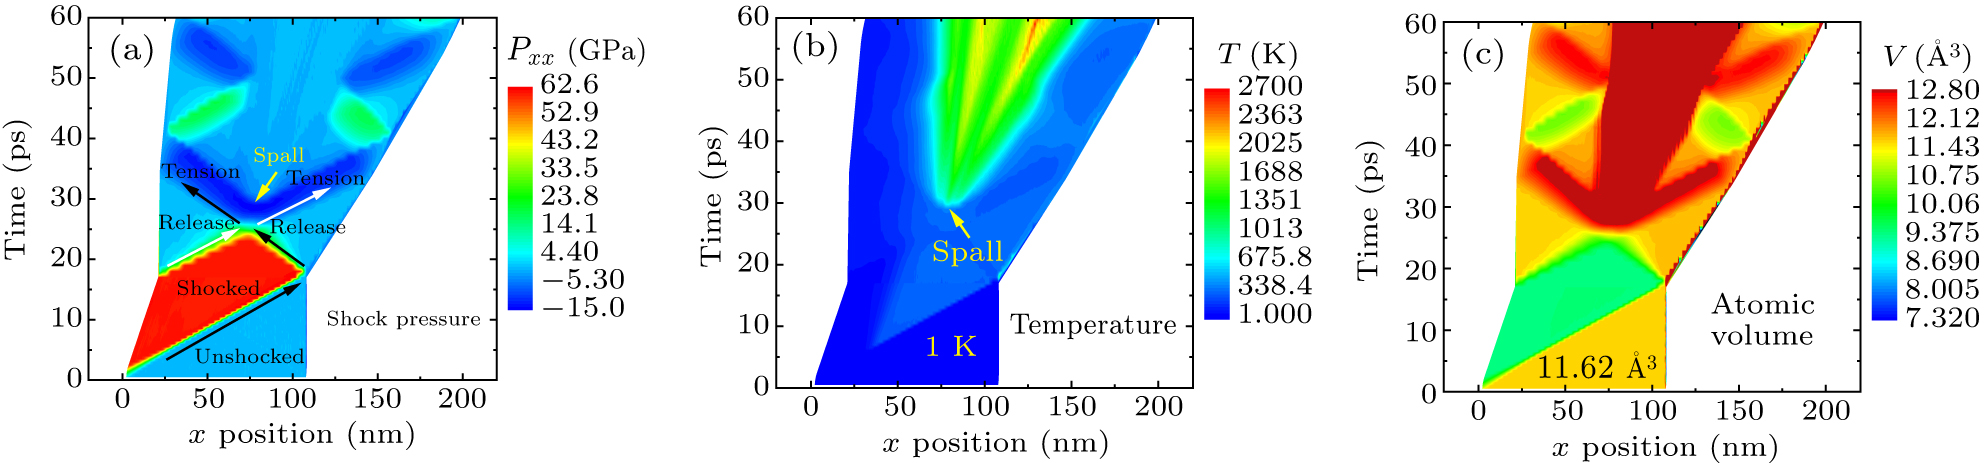
Figure 4. Position–time (x–t) diagrams for shock compression and release in the CoCrFeNiMn20 HEA sample at Up = 1200 m⋅s−1. (a) Shock pressure, (b) temperature, and (c) atomic volume.
-
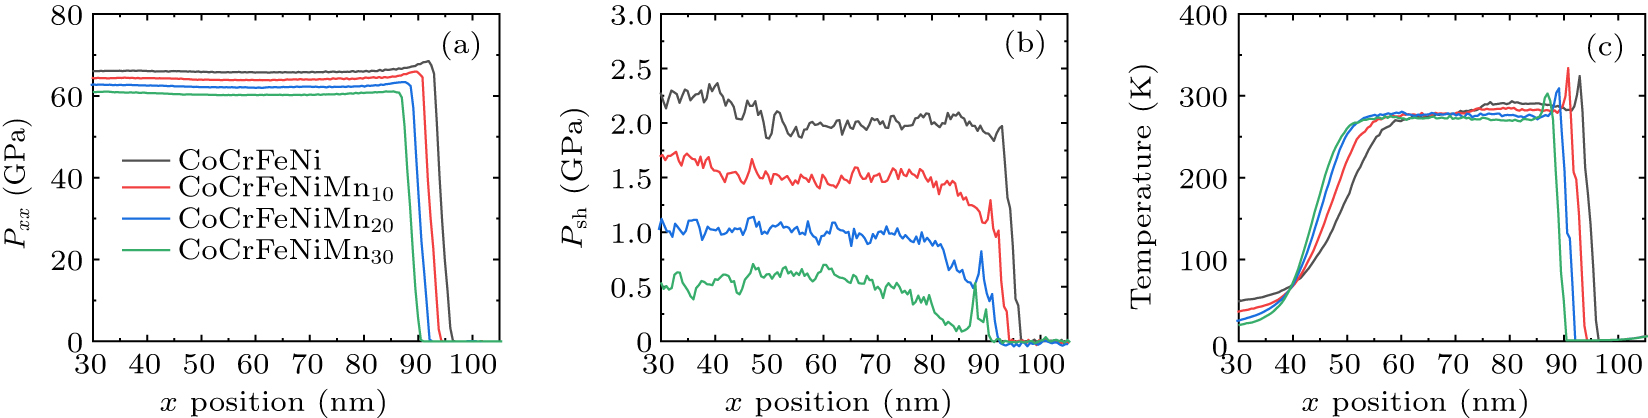
Figure 5. Shock profiles from MD simulations of CoCrFeNiMnx HEA at Up = 1200 m⋅s−1. Profiles correspond to 15 ps after the initial piston compression. (a) Shock pressure Pxx, (b) shear stress Psh, and (c) temperature T.
-
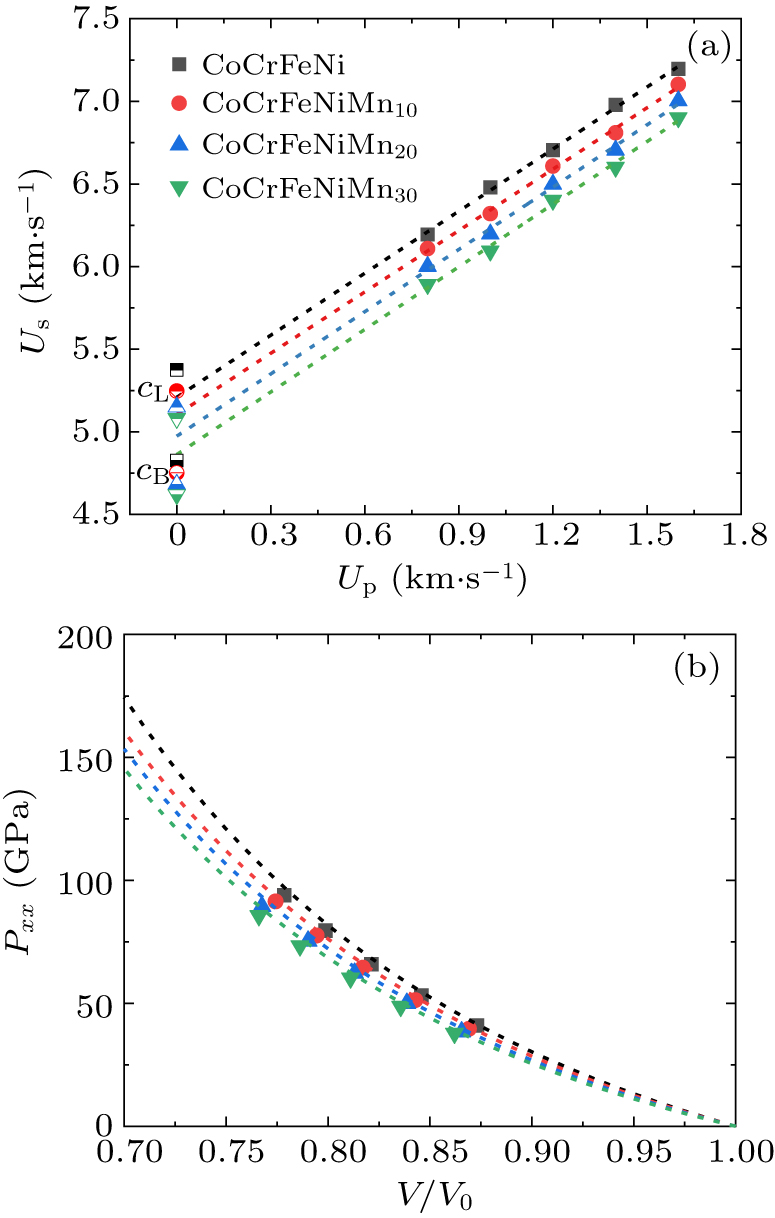
Figure 6. Shock Hugoniot data (a) Up–Us and (b) P–V/V0 of CoCrFeNiMnx HEA. The dotted lines in panel (a) are linear fit to the MD results. The dotted lines in panel (b) are calculation Hugoniot curves using Eq. (3).
-
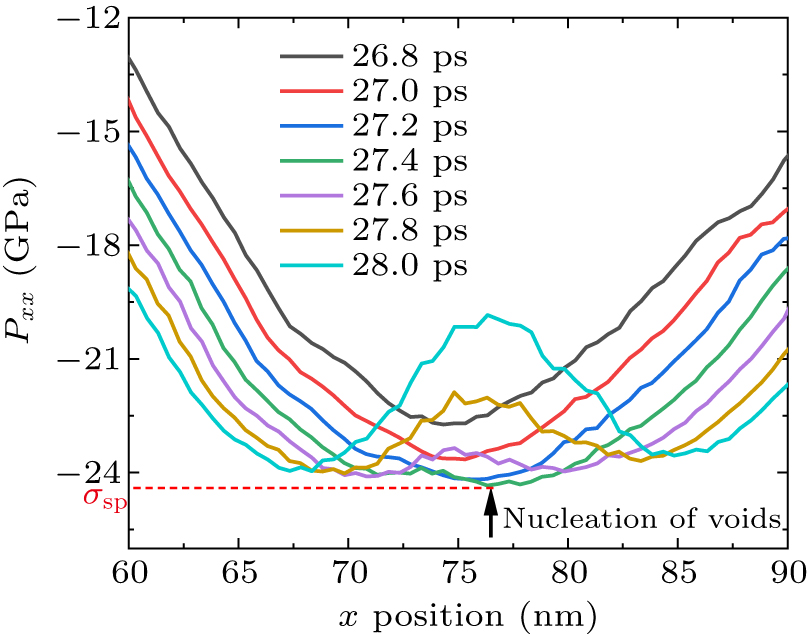
Figure 7. The evolution of Pxx profiles for CoCrFeNi HEA sample at Up = 1200 m⋅s−1 during the spallation process.
-
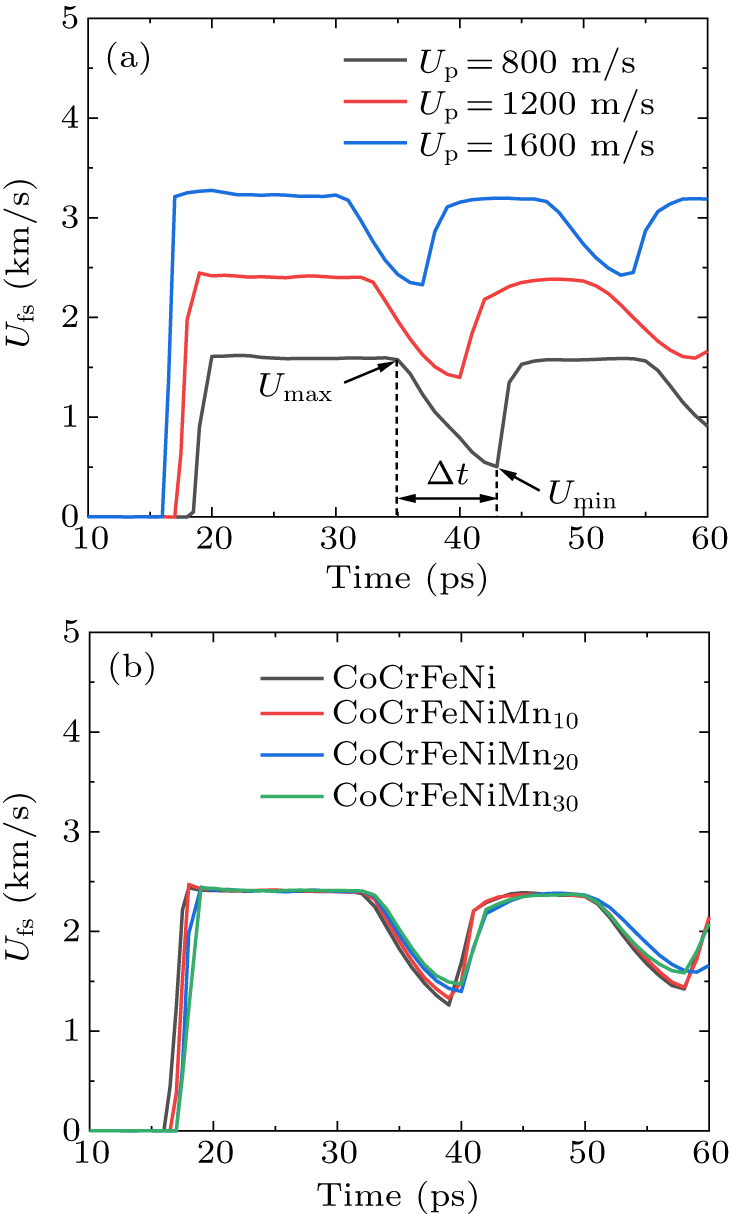
Figure 8. Free surface velocity histories of (a) CoCrFeNiMn20 HEA at various Up and (b) CoCrFeNiMnx HEA at Up = 1200 m⋅s−1.
-
-
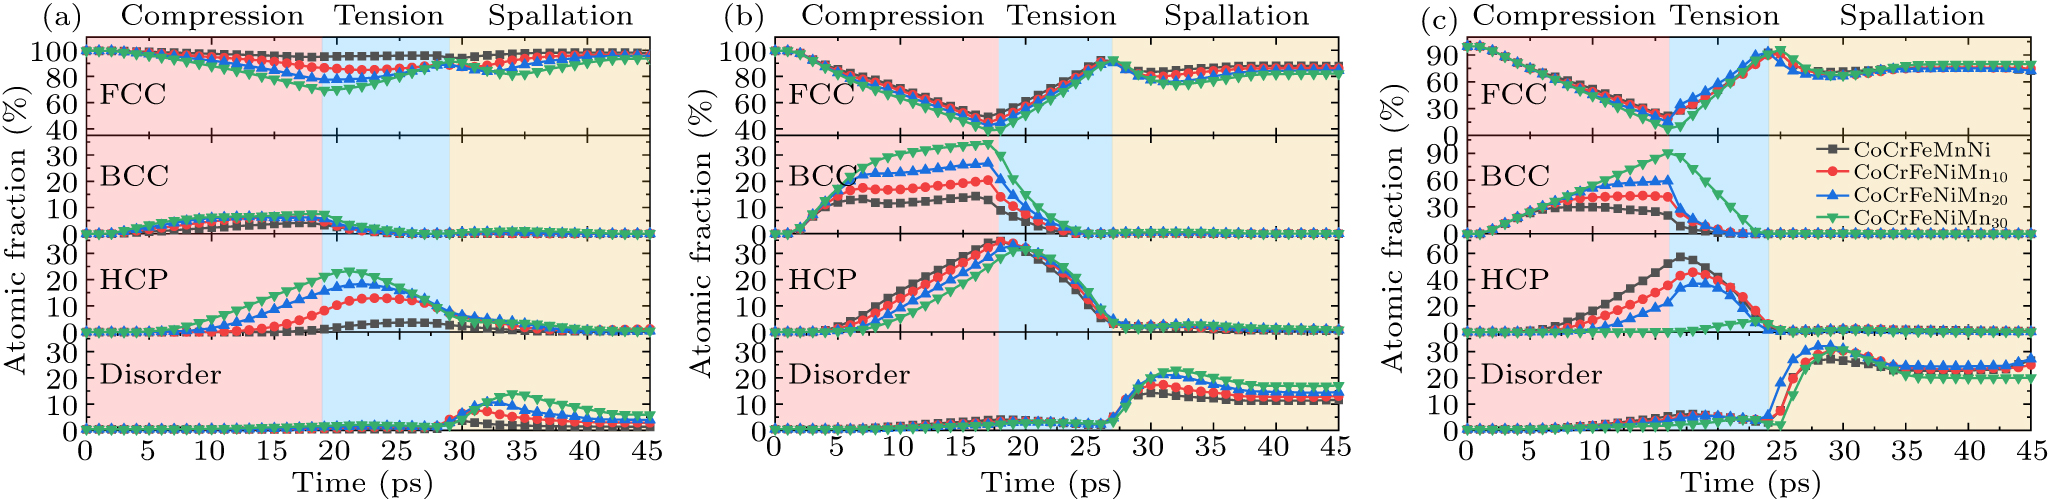
Figure 10. Atomic fraction of FCC, BCC, HCP and disordered structures as a function of time: (a) Up = 800 m⋅s−1, (b) Up = 1200 m⋅s−1, (c) Up = 1600 m⋅s−1.
-
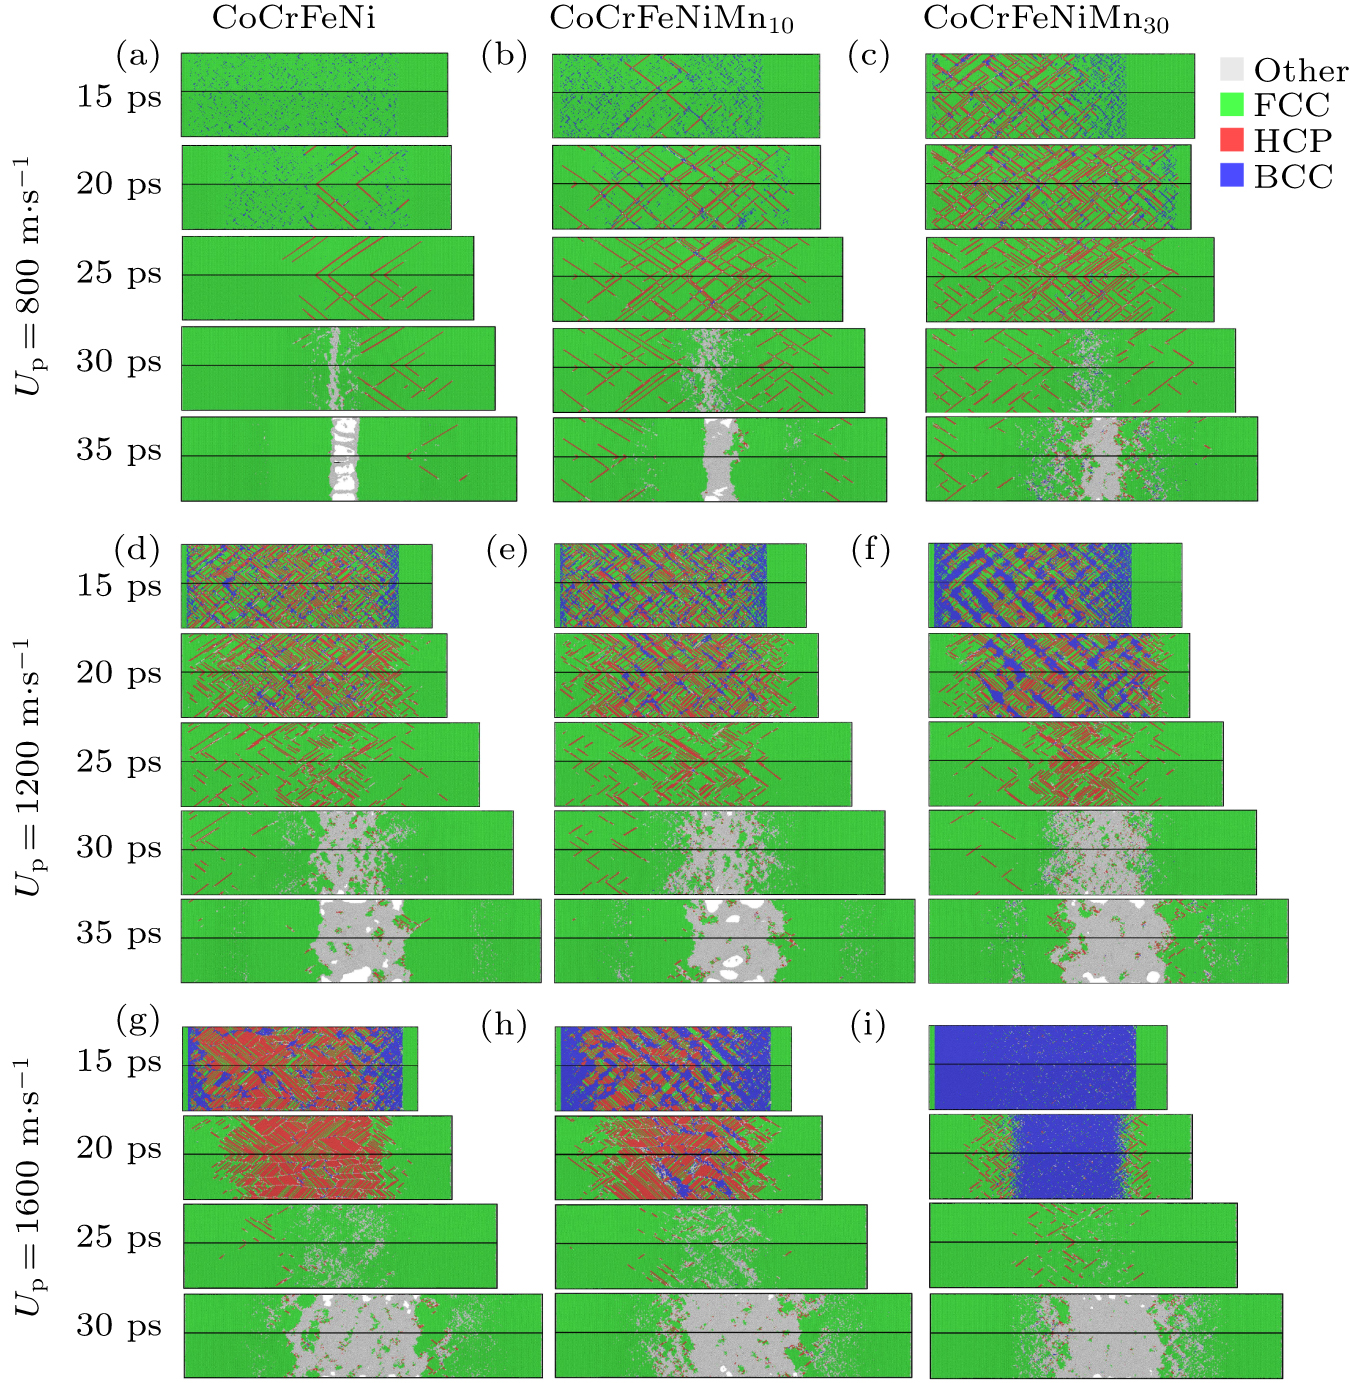
Figure 11. Snapshots of shock-induced structural changes of CoCrFeNiMnx HEA. (a)–(c) Up = 800 m⋅s−1, (d)–(f) Up = 1200 m⋅s−1, (g)–(i) Up = 1600 m⋅s−1.
-
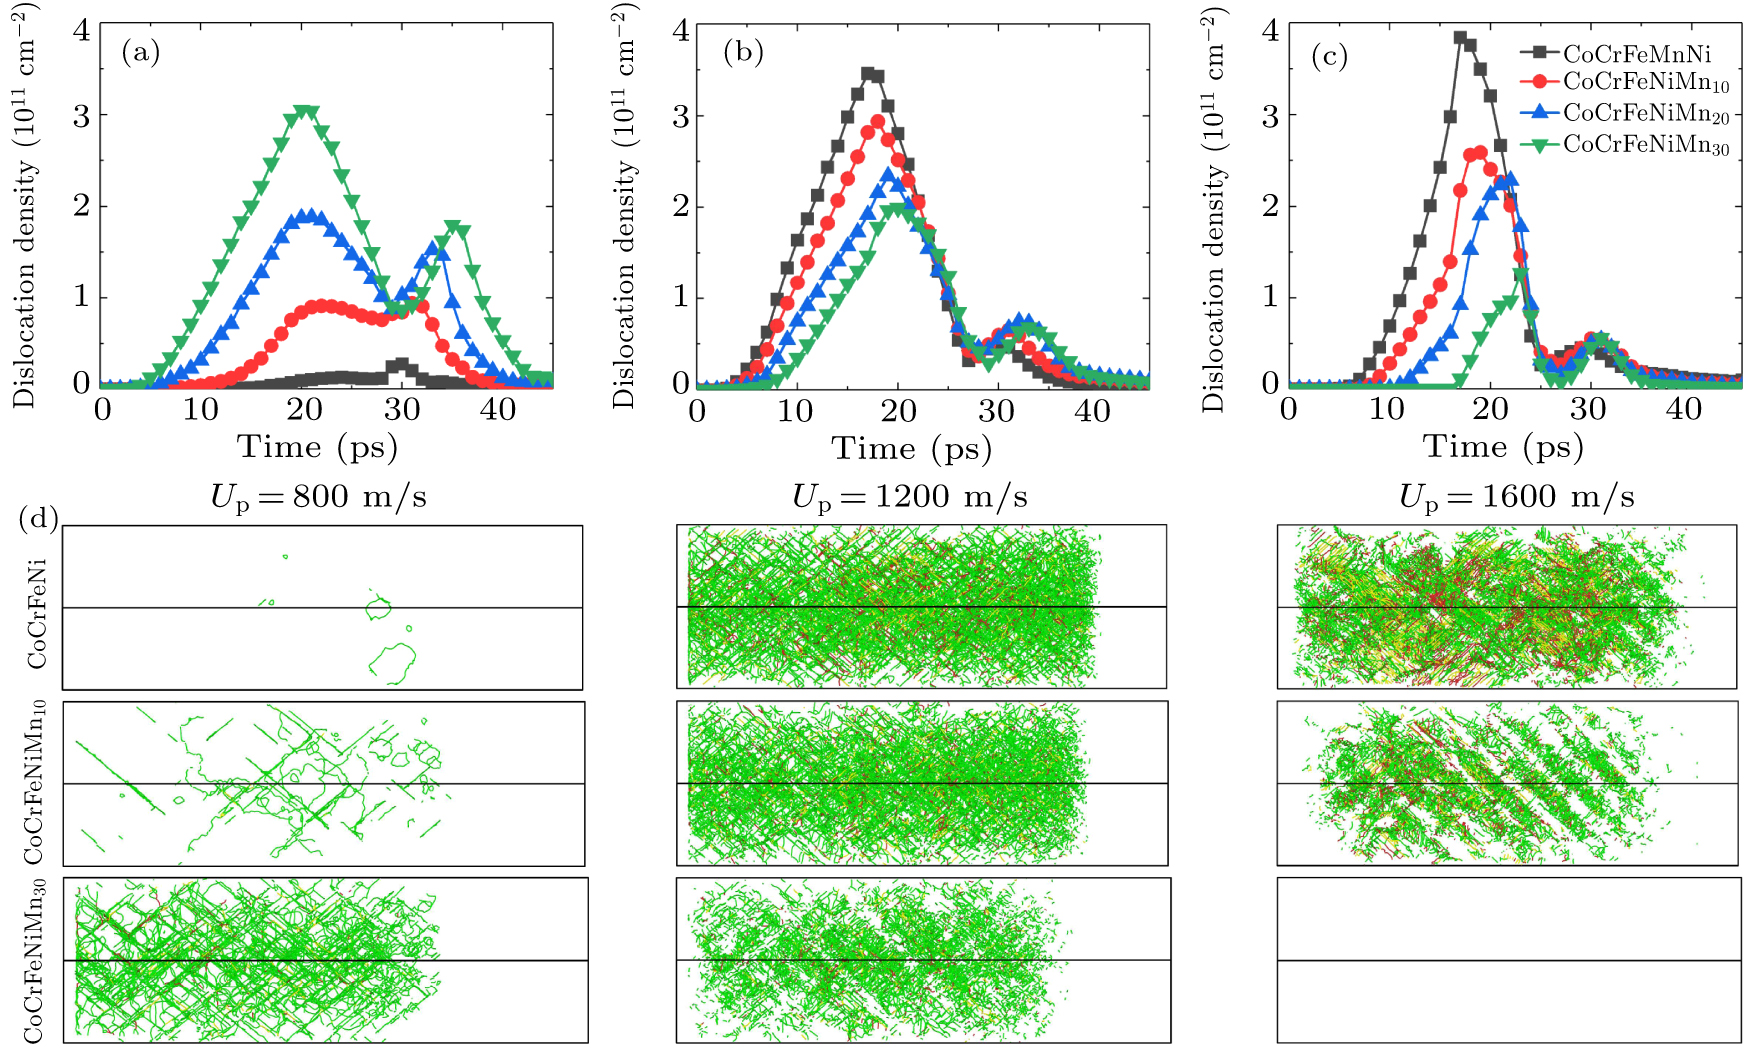
Figure 12. Evolution of dislocation density as a function of time: (a) Up = 800 m⋅s−1, (b) Up = 1200 m⋅s−1, and (c) Up = 1600 m⋅s−1. (d) Dislocation distribution for different Up and Mn contents at 15 ps.
Figure
12 ,Table
3 个